Fig. 3.
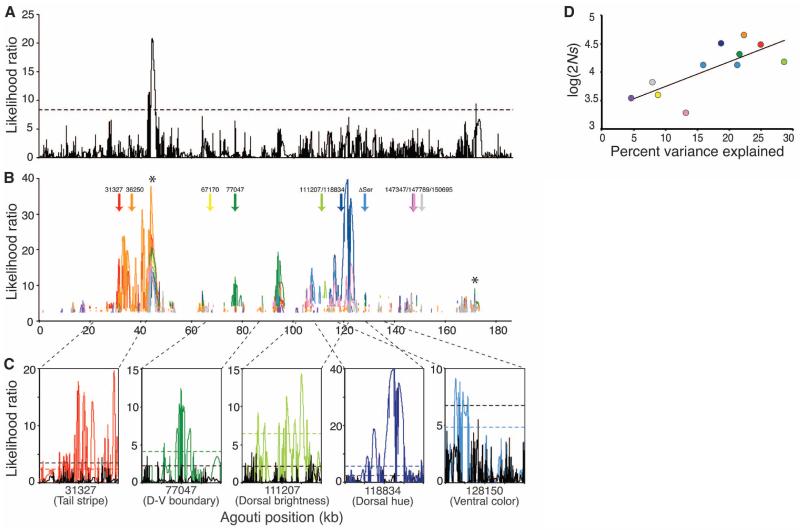
Evidence of selection on light Agouti alleles. (A) Likelihood surface for all haplotypes with significance threshold [dotted line; determined by simulation (13)]. (B) Likelihood surface for only light haplotypes. Arrows indicate the positions of 10 candidate polymorphisms identified by association mapping (Fig. 2), and likelihood surfaces are colored according to the haplotypes determined by the corresponding polymorphism (e.g., the red LR trace was estimated using only those chromosomes carrying the light allele at position 31327). Significance thresholds were determined separately for each data set, and only LRs that are above these thresholds are shown. Asterisks give the location of peaks identified using all haplotypes (A). (C) Twenty-kbp windows (13) centered on the most strongly associated polymorphism for each trait (31327, tail stripe; 77047, dorsal-ventral boundary; 111207, dorsal brightness; 118834, dorsal hue; 128150 (ΔSer), tail stripe and ventral color). Likelihood surface for dark haplotypes only (solid black line) compared with those for light haplotypes only (solid colored lines). Dotted lines are significance thresholds (black, dark only; colored, light only). (D) Strength of selection (s) is significantly correlated with PVE (R2 = 0.56; Spearman’s rho = 0.76; P = 0.0071). Color of each SNP as in (B).

