
Figure 3.
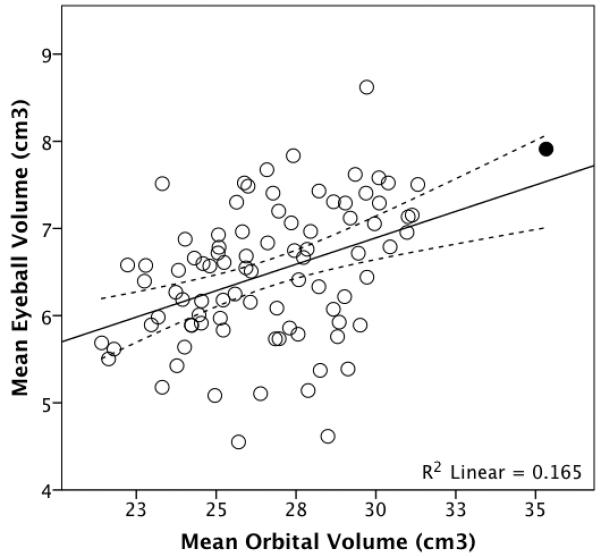
Mean eyeball volume plotted against mean orbital volume for 88 living humans. The dotted lines represent 95% confidence intervals for the regression line. Removing the high outlier (shaded) makes no difference to the analyses.
Official websites use .gov
A
.gov website belongs to an official
government organization in the United States.
Secure .gov websites use HTTPS
A lock (
) or https:// means you've safely
connected to the .gov website. Share sensitive
information only on official, secure websites.
Mean eyeball volume plotted against mean orbital volume for 88 living humans. The dotted lines represent 95% confidence intervals for the regression line. Removing the high outlier (shaded) makes no difference to the analyses.