Figure 4.

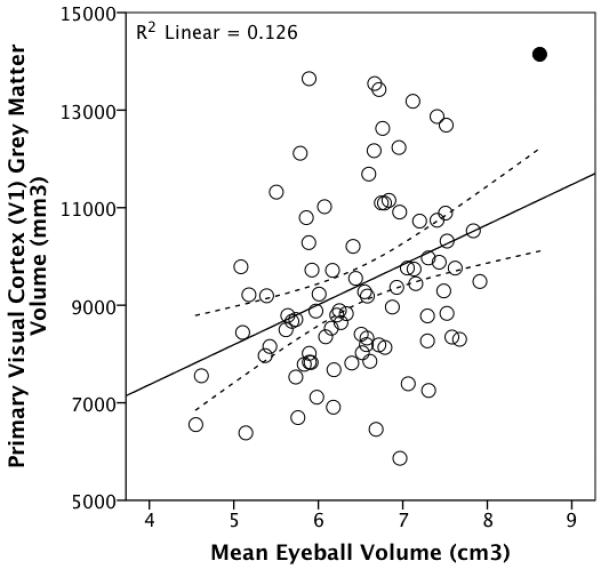
Total V1 grey matter volume plotted against mean eyeball volume for a sample of 88 living humans. The outlier is shaded (see main text). The dotted lines represent 95% confidence intervals for the regression line.

Total V1 grey matter volume plotted against mean eyeball volume for a sample of 88 living humans. The outlier is shaded (see main text). The dotted lines represent 95% confidence intervals for the regression line.