
Figure 4.
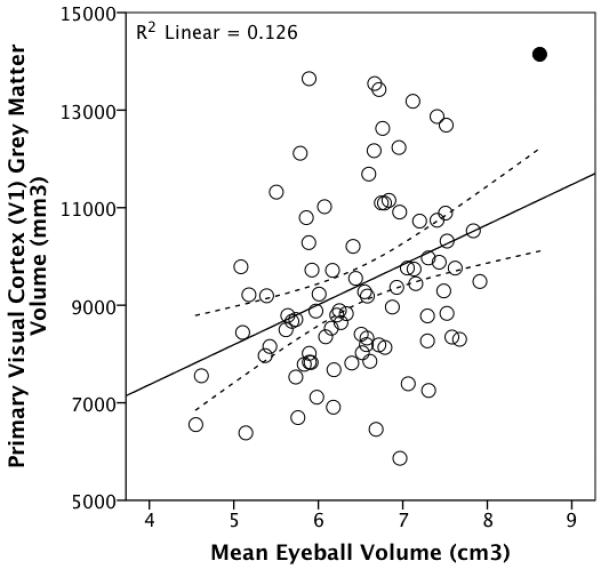
Total V1 grey matter volume plotted against mean eyeball volume for a sample of 88 living humans. The outlier is shaded (see main text). The dotted lines represent 95% confidence intervals for the regression line.
Official websites use .gov
A
.gov website belongs to an official
government organization in the United States.
Secure .gov websites use HTTPS
A lock (
) or https:// means you've safely
connected to the .gov website. Share sensitive
information only on official, secure websites.
Total V1 grey matter volume plotted against mean eyeball volume for a sample of 88 living humans. The outlier is shaded (see main text). The dotted lines represent 95% confidence intervals for the regression line.