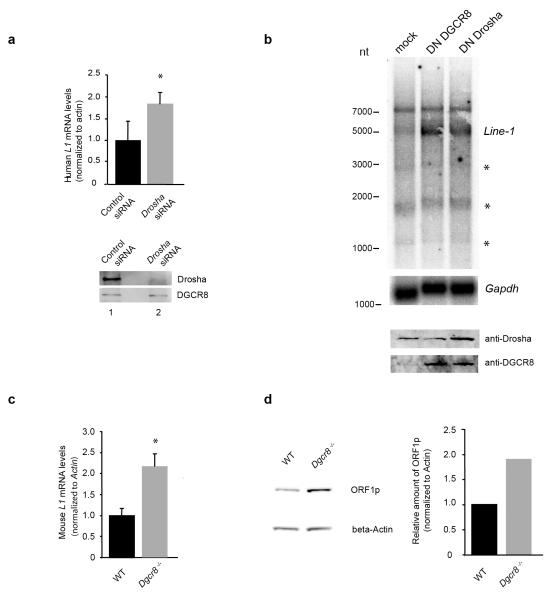
Figure 2.
The Microprocessor regulates the abundance of L1 mRNA and L1-encoded ORF1p protein. (a) Real time RT-PCR analysis of endogenous L1 mRNA in PA-1 cells upon depletion of Drosha. Western blot analysis confirms Drosha depletion (bottom panel). (b) Northern blot analysis of endogenous polyadenylated L1 mRNA in PA-1 cells upon overexpression of Dominant negative (DN) forms of both DGCR8 (lane 2) and Drosha (lane 3 (asterisks depict smaller fragments arising from cryptic splice sites or truncated versions of L1 mRNAs). Gapdh hybridization was used as a loading control. Western blot analysis shows the level of expression of the DN forms (bottom panel). (c) Real time RT-PCR analysis of mouse TF L1 mRNA in Dgcr8−/− mouse ES cells and parental ES cells (WT). (d) Western blot analysis of L1-ORF1p in Dgcr8−/− mouse ES cells and parental ES cells (WT). Western-blot was quantified using ImageQuant TL software (GE) plotted data are the average of 3 technical replicates. (a) and (c) values are averages of three independent biological replicates; *P< 0.05 (t test). Error bars, s.d. Uncropped versions of the blots are shown in Supplementary Fig. 8.

