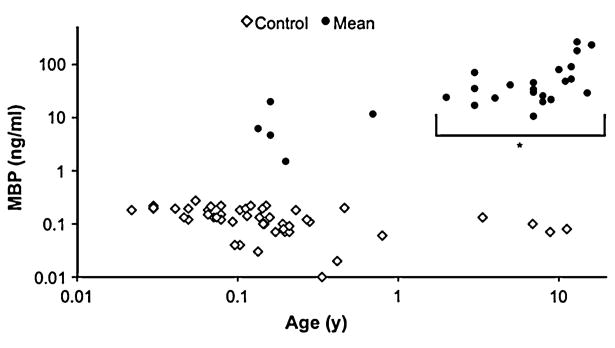
Fig. 4.
Scatter plot of mean CSF MBP concentration for each patient (filled circle) andcontrol (open diamond) versus age. Horizontal and vertical scales are logarithmic. There was no significant difference in CSF MBP concentrations between controls <1 versus those ≥1 year old, though TBI patients ≥1 year old demonstrated significantly higher concentrations than those <1 year old

