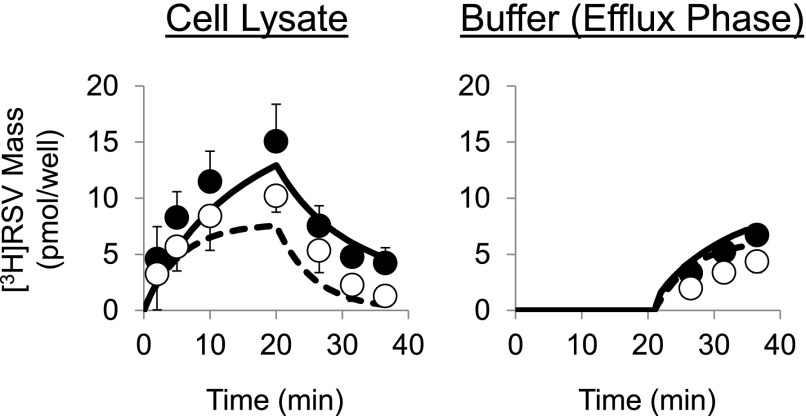
Fig. 5.
[3H]Rosuvastatin (RSV) mass versus time data in human sandwich-cultured hepatocytes (SCH) during the uptake and efflux phase. Closed symbols/solid lines represent [3H]RSV mass in cells + bile (standard HBSS), and open symbols/dashed lines represent [3H]RSV mass in cells (Ca2+-free HBSS). The simulated mass-time profiles were generated from the relevant equations based on the model scheme depicted in Fig. 3B and the final parameter estimates reported in Table 1. Data (pmol/well) are reported as mean ± S.E.M. (n = 3 SCH preparations in triplicate).

