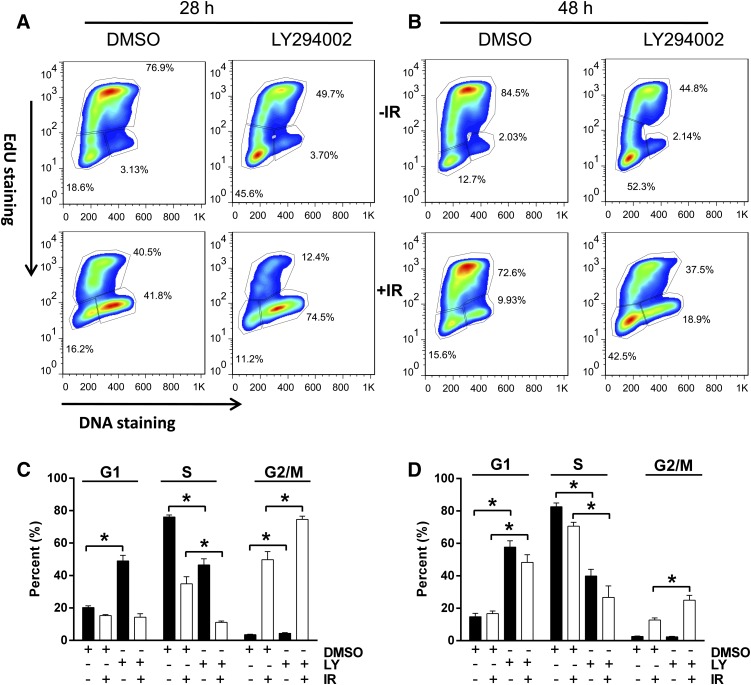
Fig. 8.
Cell cycle analysis after LY294002 treatment. NCCIT cells were exposed to 0 or 4 Gy γIR, plated, incubated at 37°C for 1 hour before treatment with DMSO vehicle or LY294002 (LY) (6.25 μM). Cells were incubated for 21 or 41 hours and then treated with 10 μM 5-ethynyl-2′-deoxyuridine (EdU). After an additional 6 hours of incubation, the cells were harvested and analyzed with FACSCalibur. (A and B) Representative flow cytometry profiles. The cell cycle phases are outlined, with the upper quadrant indicating the S phase cell population, the lower right being the G2/M phase population, and the lower left reflecting the G1 phase cells. Quantitative cell cycle distribution 28 hours (C) or 48 hours (D) after IR exposure. Black columns indicate nonirradiated cells, and white columns indicate irradiated cells. N = 3. Bars = S.E.M. *P < 0.05, Student’s t test.

