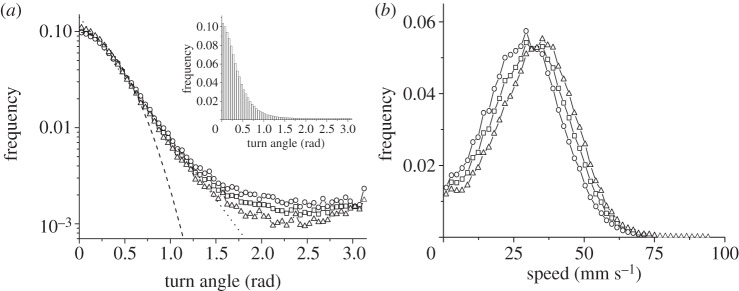
Figure 4.

Frequency distribution of (a) turn angles and (b) instantaneous speeds for risk-prone and risk-averse trajectories compared to the overall behavior. Gaussian and exponential fits (dashed and dotted lines, respectively) of the turn angle distribution are shown for the overall behaviour. Inset: frequency distribution in normal scale emphasizing the emergence of a uniform distribution for large turning angles. Squares, all trajectories; triangles, risk-prone; circles, risk-averse trajectories.
