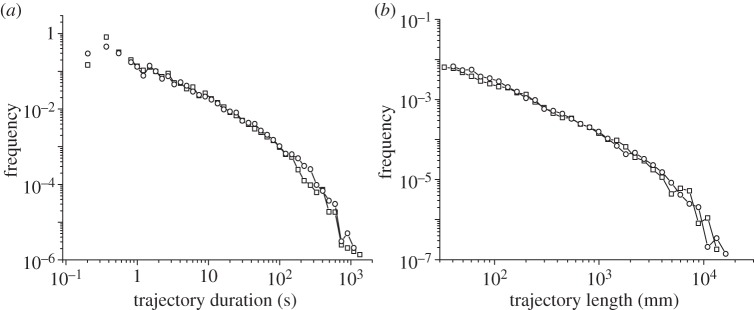
Figure 9.

(a) Direct comparison between the frequency distribution of the trajectory durations and (b) lengths obtained from experiments and those obtained from the random-walk approach proposed here. The fit has been obtained by using a standard deviation of 0.17 rad−1 for turn angles, with f1 = 0.9, f2 = 0.7. For the switching we used γ1 = 0.1 s−1, γ2 = 0.3 s−1 for the risk-prone strategy (risk-averse trajectories are assumed to stay permanently in the ‘homing’ mode), with a 90% of risk-averse trajectories and a 10% to risk-prone (in accordance with our observations). (a,b) Squares, experimental; circles, simulated.
