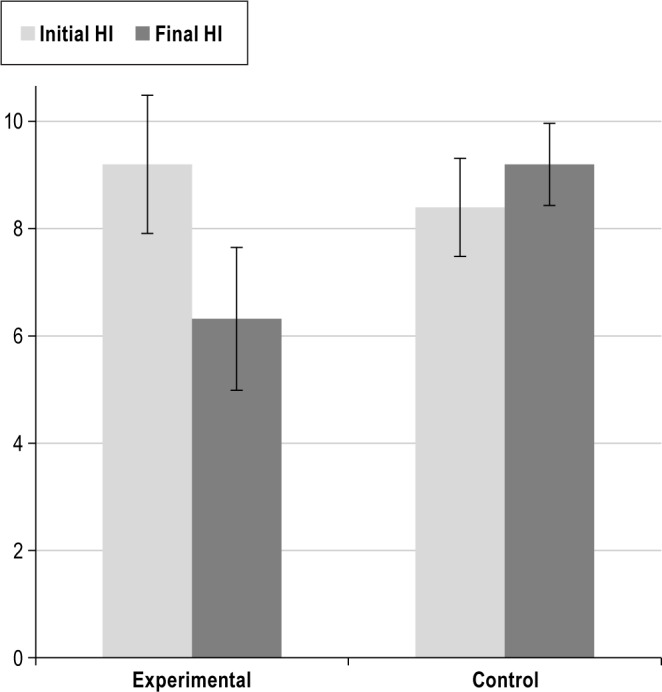
Figure 2. Comparison of initial and final handicap indexes among skilled golfers.

Bars represent handicap indexes as reported by all golfers with an initial handicap index of 12 or less, both in the OSAS group (n = 5) and in the control group (n = 6). Averages ± standard error are shown.
