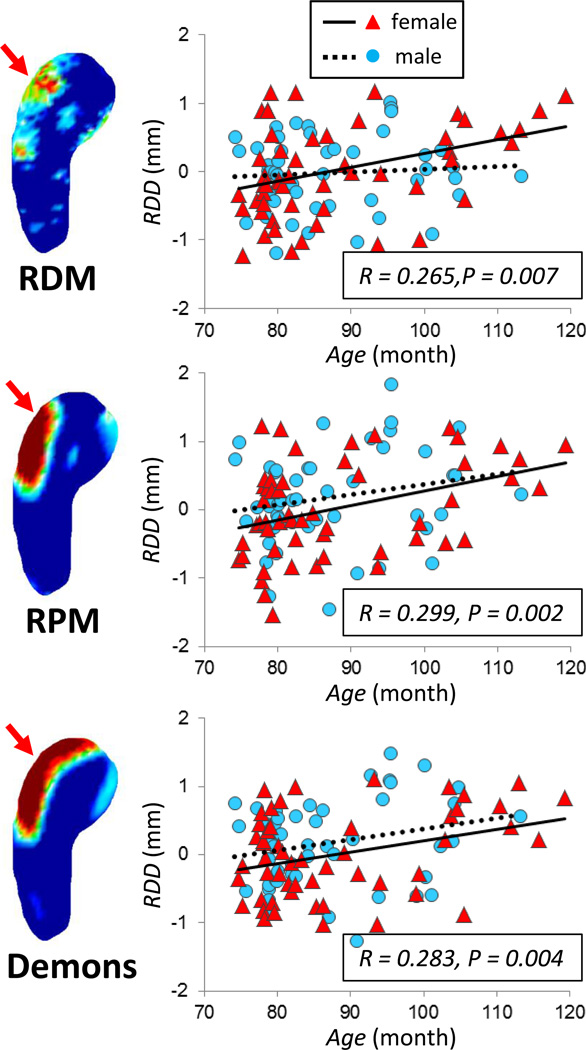
Figure 7.
The age correlation of the mean RDD value analyzed in a selected ROI (approximately 7.1 mm2) placed over the 3-dimensional surface of the head region on the right hippocampus. The Pearson’s correlation coefficient r and the p values analyzed using the whole group are indicated in each figure, which are significant for all 3 methods. The older subjects are more likely to have positive RDD, indicating expanded hippocampus compared to the template in the head region of the right hippocampus. Different symbols and fitting lines are used for males and females, respectively.

