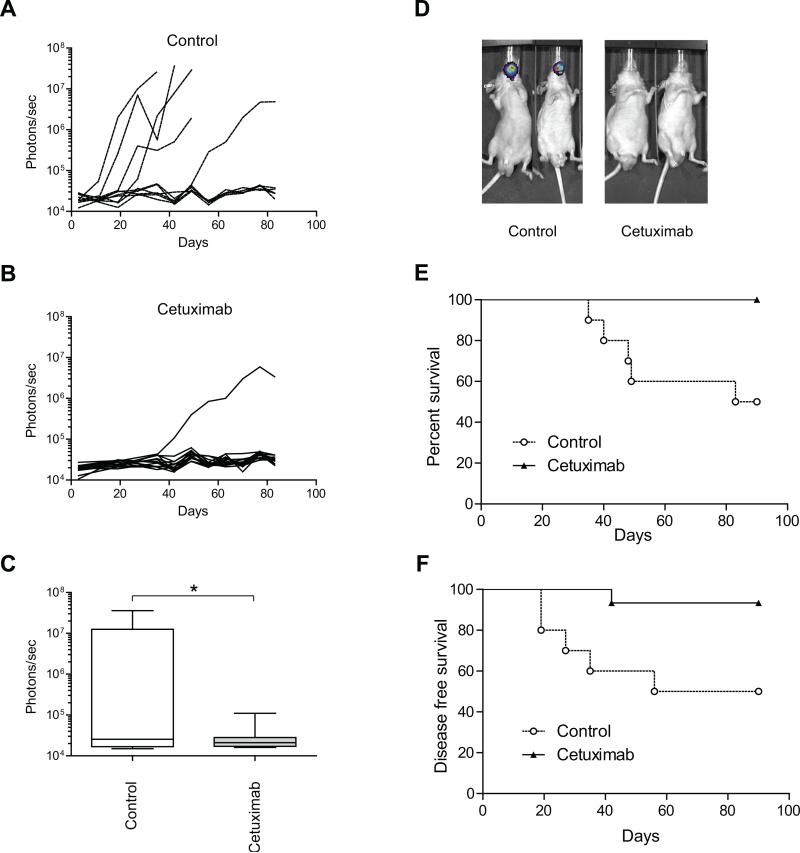
Figure 2.
The effects of treatment with cetuximab on tumor growth, tumor formation, overall survival and disease-free survival in an in vivo model of microscopic residual disease. A, Individual mouse data are shown for the control group (10 mice). B, Individual mouse data are shown for the cetuximab treatment group (15 mice). Photon counts were calculated from the imaging data using the IVIS Living Image software. C, Box-and-whisker plots illustrating the effects of treatment on an in vivo model of microscopic residual disease followed by bioluminescence imaging on day 35 after cell inoculation. Horizontal lines in the boxes, mean. Bottom and top boundaries of boxes, 25th and 75th percentiles, respectively. Lower and upper whiskers, 5th and 95th percentiles, respectively. *, P < 0.05. D, Representative bioluminescence images corresponding to OSC-19-luc tumors from each treatment group, 35 days after cell inoculation. Photon counts were calculated from the imaging data using the IVIS Living Image software. E, The in vivo effects of treatments on the overall survival of tumor-bearing OSC-19 mice. F, The in vivo effects of treatment on the disease-free survival of OSC-19 tumor-bearing mice. Animals were euthanized at 90 days after cell inoculation or when they had lost more than 20% of their initial body weight. Survival was analyzed by the Kaplan-Meier method and compared with log-rank tests.

