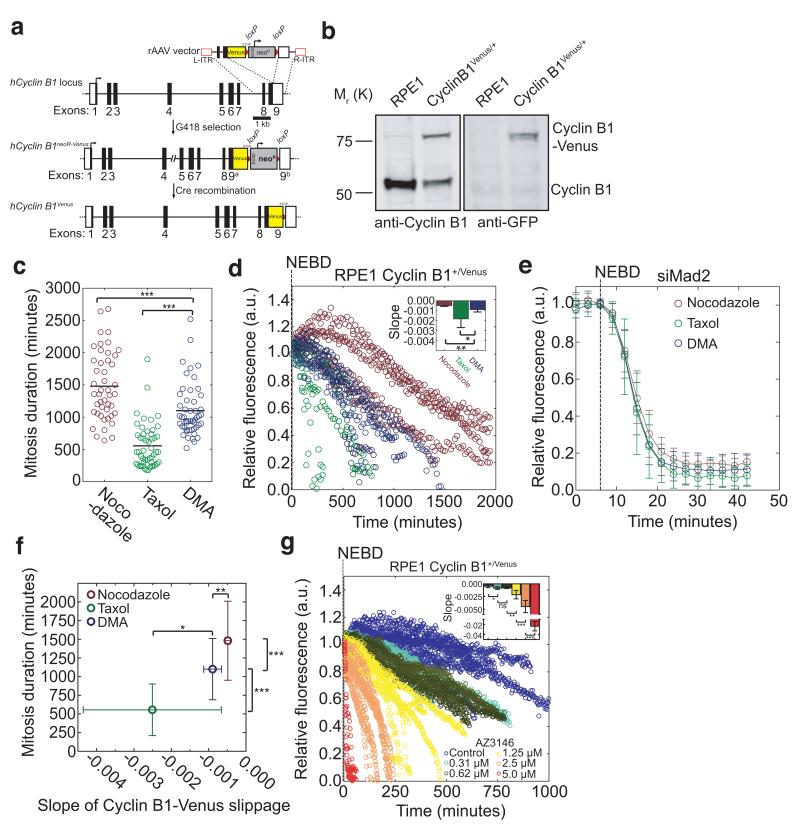
Fig. 2. Different spindle poisons activate the SAC to different extents.
(a) Venus ORF targeting into the hCCNB1 locus by rAAV-mediated homologous recombination. The rAAV vector contains both the coding sequence of Venus and a G418 resistance cassette (flanked by loxP sites, red triangles), which were inserted between two gene-specific homology arms to replace the STOP codon at the junction between non-coding (white square) and coding (black square) regions in exon 9 and two inverted terminal repeats (L-ITR, R-ITR; red rectangles). Integrants were selected by survival in G418-containing medium. (b) Western blot analysis of parental RPE1 and a Cyclin B1-Venus clone. Cell lysates were probed with anti-Cyclin B1 (left panel) and anti-GFP (right panel) antibodies. Note the two forms of Cyclin B1 in the Cyclin B1-Venus clone (the upper one uniquely recognized by the anti-GFP antibody). Molecular mass markers on the left. (c) Scatter plot displaying the duration of the mitotic arrest of RPE1 Cyclin B1-Venus cells treated with the same drugs as in Fig. 1c) (n=50 in each condition). (d) Single-cell analysis of mitotic slippage in asynchronously growing RPE1 Cyclin B1-Venus cells treated with nocodazole (n=5 cells), Taxol (n=6 cells) or DMA (n=5 cells). Images were acquired at 5 min intervals and quantified, plotted and analysed as in Fig 1c. The inset shows the slopes of the linear regressions in the main panel. Error bars indicate s.d. and are representative of at least two independent experiments. (e) Single-cell analysis of asynchronously growing RPE1 Cyclin B1-Venus cells treated with siRNA against Mad2 in presence of nocodazole (n=6 cells), Taxol (n=13 cells) or DMA (n=16 cells). Note that only cells with mitosis durations of 9-12 minutes (minimum mitosis duration in RPE1 cells) were considered. Error bars indicate s.d. and are representative of at least two independent experiments. (f) Effect of the rate of Cyclin B1-Venus slippage in d) on the duration of mitosis in different drug treatments in c). Error bars indicate s.d. and are representative of at least two independent experiments. (g) Single-cell analysis of mitotic slippage in asynchronously growing RPE1 Cyclin B1-Venus cells treated with nocodazole (n=7 cells) and increasing AZ3146 concentrations (n=5 cells for 0.31 μM; n=6 cells for 0.62 μM; n=6 cells for 1.25 μM, n=9 cells for 2.5 μM and n=7 cells for 5 μM). Images were acquired at 5 min intervals and total fluorescence was quantified. Fluorescence intensities were normalised to the level at NEBD. The insets show the slopes of the linear regressions in the respective main panel. Error bars indicate s.d. and are representative of two independent experiments.

