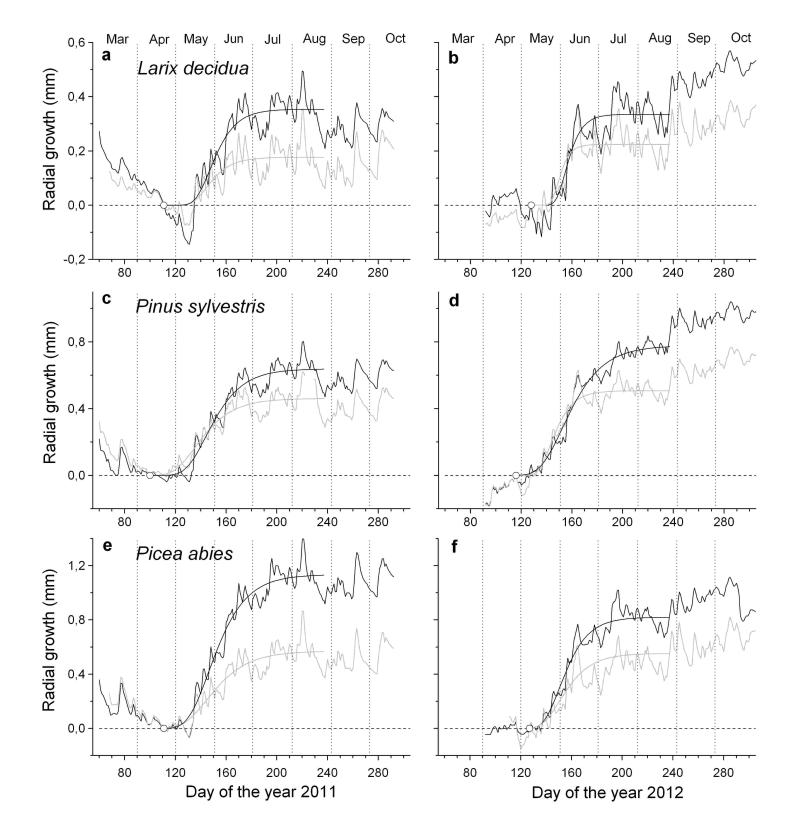
Fig. 3.
a-f Mean daily radial increment curves of Larix decidua (a, b), Pinus sylvestris (c, d) and Picea abies (e, f) in 2011 and 2012 modelled by applying the Gompertz function. Dendrometer records from the rain-sheltered and control plot are indicated in black and grey lines, respectively. Open circles indicate development of first horizontal row of enlarging tracheids.

