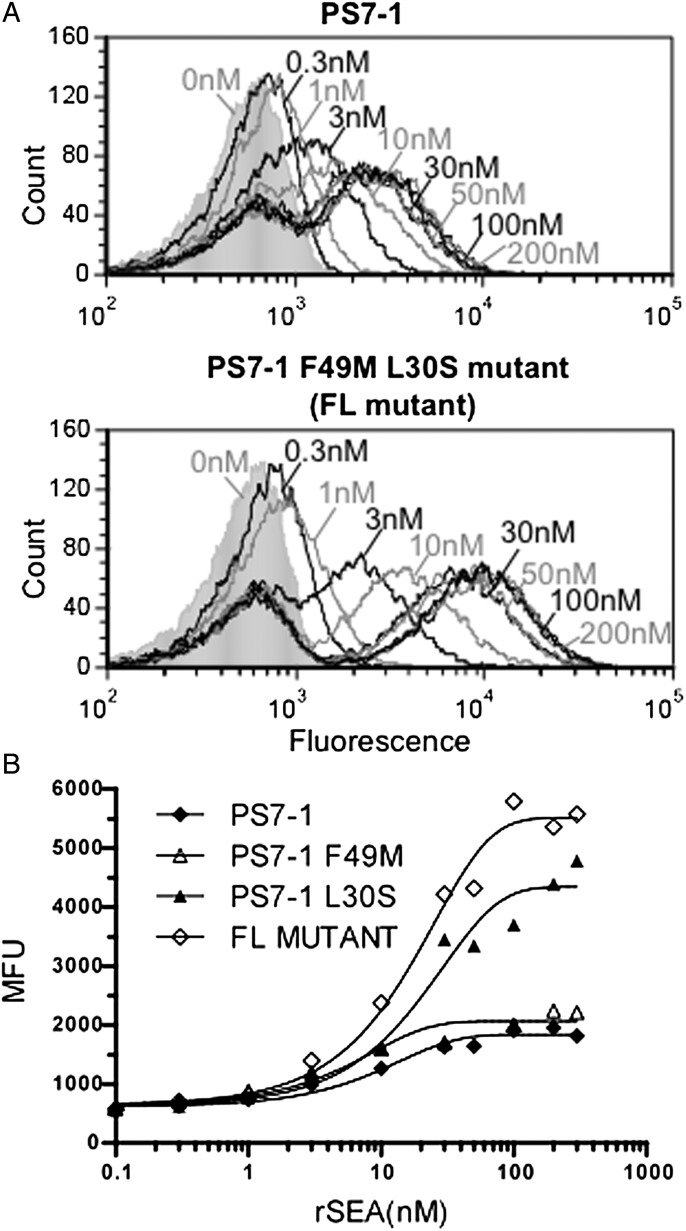
Fig. 4.
Effect of mutations at residues 30 and 49 in PS7-1: generation of FL mutant. (A) Flow cytometry histograms for binding of PS7-1 (top) and FL mutant (bottom) with various concentrations of biotinylated-SEA. Fluorescence in the absence of SEA is represented by gray (filled) peak. (B) SEA-binding titration of various mutants of PS7-1. MFUs are plotted on the y-axis and the concentrations of SEA are plotted on the x-axis. Data shown are representative of two experiments.

