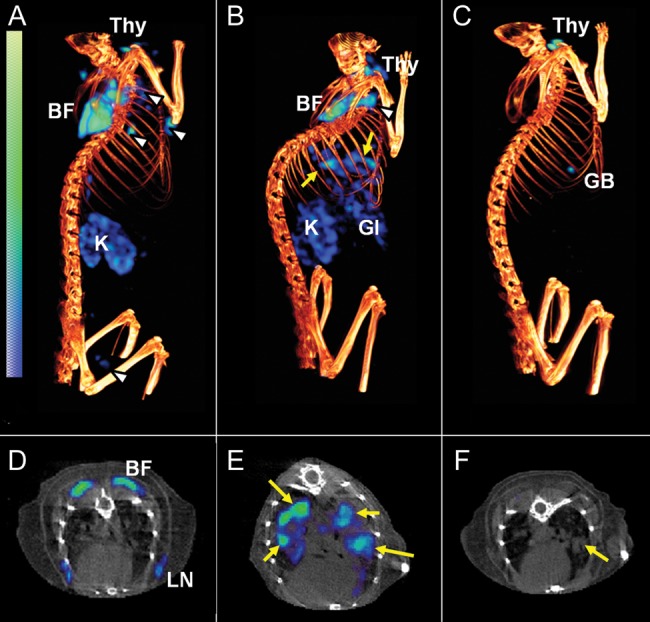
Figure 2.

[125I]Iodo-DPA-713 single-photon emission computed tomography–high-resolution CT (SPECT-CT) of C3HeB/FeJ mice. Coregistered [125I]iodo-DPA-713 SPECT-CT images from representative Mycobacterium tuberculosis–infected C3HeB/FeJ mice are shown. Compared with uninfected control mice (A and D), in which only minimal pulmonary SPECT signal is noted, discrete areas of signal, colocalizing with the tuberculosis lesions seen on CT, are observed in the infected mouse (B and E; yellow arrows). Auto-blockade abrogates the SPECT signal from the lungs of infected-mice (C). While the tuberculosis lesion is clearly seen on the CT image (F; yellow arrow), no corresponding SPECT signal is noted because of the auto-blockade. Signal is also noted in brown fat (BF), lymph nodes (white arrowheads), gallbladder (GB), thyroid (Thy), lymph node (LN), gastrointestinal tract (GI), and kidneys/adrenal glands (K).
