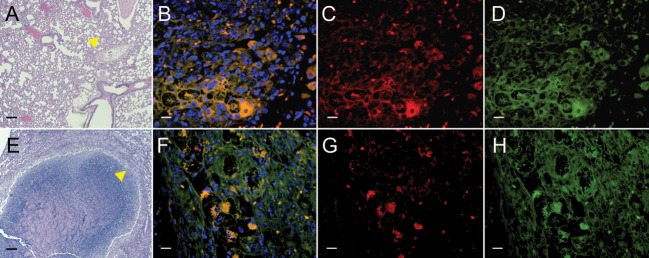
Figure 4.

Translocator protein (TSPO) expression in tuberculosis lesions. Lung sections from Mycobacterium tuberculosis–infected BALB/c mice or C3HeB/FeJ mice show pneumonic tissues (BALB/c; A [arrow]) or the cellular margins of a necrotic tuberculosis granuloma (C3HeB/FeJ; E [arrow]). This region has dense infiltration by inflammatory cells, such as lymphocytes and activated macrophages. Higher-power views (A and E; yellow arrows) demonstrate immunostaining for TSPO (C and G; red), CD68 (D and H; green), and overlay of TSPO and CD68 with nuclear stain (B and F) are also shown. Note that there are many CD68+ cells in this region, with high TSPO expression that colocalizes with the CD68 signal (yellow; B and F). Scale bars represent 100 μm (for A and E) or 25 μm (for all other panels).
