
Figure 1.
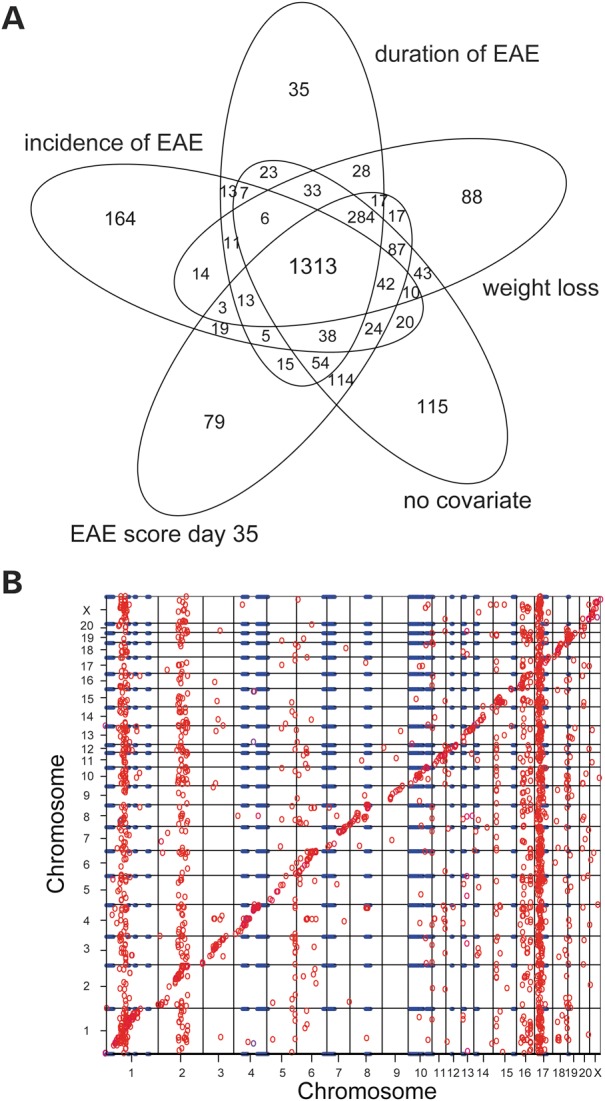
Expression QTLs in chronic stage EAE. (A) Venn diagram indicating the number of overlapping transcripts when performing a whole genome scan for eQTLs using different clinical disease variables as covariates. (B) Scatter plot with the x-axis depicts the genomic position of the eQTL and the y-axis depicts the genomic location of the target gene. Each circle represents a significant cis- or trans-eQTL (no covariates used in the model). Blue lines represent EAE QTLs identified in the DA and PVG strain combination. The diagonal band indicates cis-eQTLs and the off-diagonal circles represent trans-eQTLs. Vertical trans-eQTL bands reflect genomic regions that control many transcripts. eQTLs were generated with the Haley–Knott regression model in R/qtl; LOD ≥ 2; genome-wide corrected P-value ≤0.05.