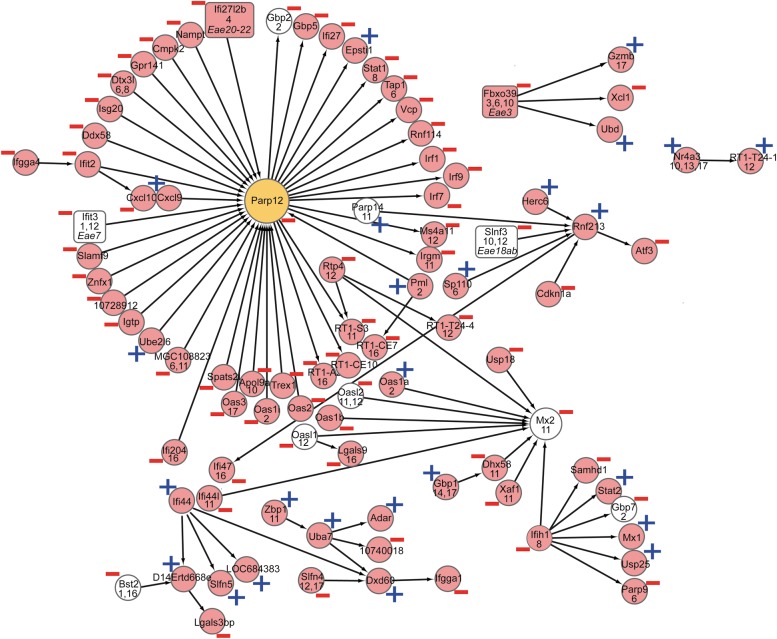
Figure 4.
Gene network associated with IFN pathway signaling. Expression traits with neighboring locations are drawn next to each other. eQTLs are indicated by their rat chromosome location on a second line and cis-eQTLs are indicated in white. eQTLs within EAE QTLs are indicated by a grey box with the QTL name listed in parentheses. Predicted hub genes are presented in orange and the black arrow heads indicate a directed interaction. Plus and minus indicate association to EAE phenotype. Genes with a higher disease association are placed to the right, whereas causative genes are placed toward the left.

