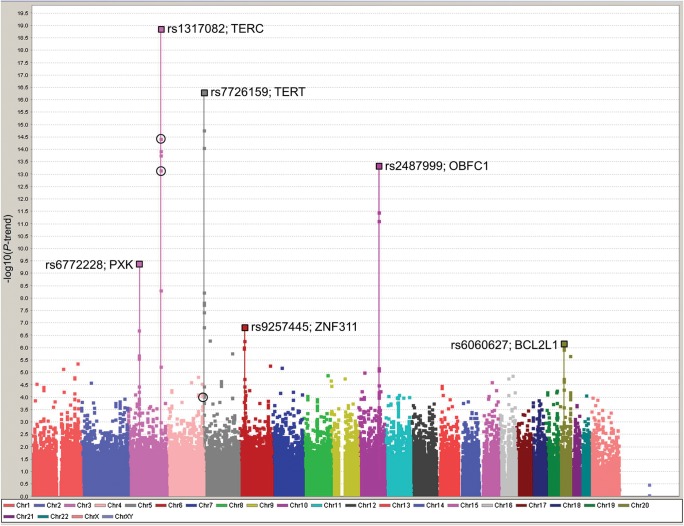
Figure 1.
Manhattan plot of all iCOGS SNPs and TL in all 26 089 participants (healthy controls and cancer cases) from the CCHS, CGPS and SEARCH studies. Solid squares represent the negative log of the per-risk-allele Ptrend against the genome position of each SNP. The lead SNPs in each of the peaks are marked with a larger square and the SNP name and gene region noted. Black open circles mark the results (in 26 089 COGS cases and controls) for the top SNPs originally selected from the GWAS meta-meta-analysis (chr3, rs10936601, Ptrend = 3.6 × 10⁻¹⁵; chr3, rs11709840, Ptrend = 6.5 × 10⁻¹⁴ and chr4, rs930306, Ptrend = 8.4 × 10⁻⁵).

