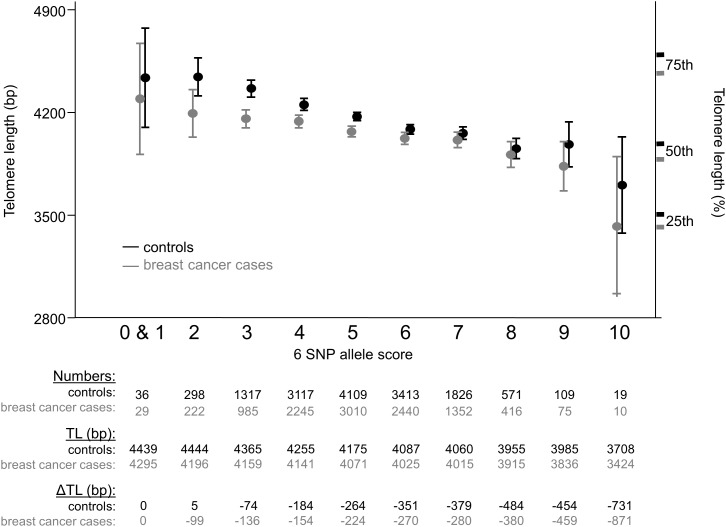
Figure 2.
The cumulative effect of the top six SNPs on TL. Mean TL and associated 95% CI in base pairs (bp) is illustrated corresponding to the number of ‘shorter telomere’ alleles carried of the six SNPs. The results for the 10 784 breast cancer cases and 14 815 controls are shown in grey and black, respectively. An additional y-axis on the right-hand side of the figure marks the TL at the 25th percentile (3438 for cases, 3525 for controls), 50th (median) (3903 for cases, 4007 for controls) and 75% percentile of length (4492 for cases, 4616 for controls), with cases and controls in grey and black, respectively. Tabulated below the graph is the distribution of the six SNP ‘shorter telomere’ allele scores among 14 815 controls by fraction of total number of individuals (numbers), the mean TL by six SNP allele score (TL) and the difference in TL compared with the lowest allele score group (0 and 1) (ΔTL). There were no individuals present with an allele score of 11 or 12. Data for breast cancer cases are again shown in grey and control data in black.

