Fig. 6.

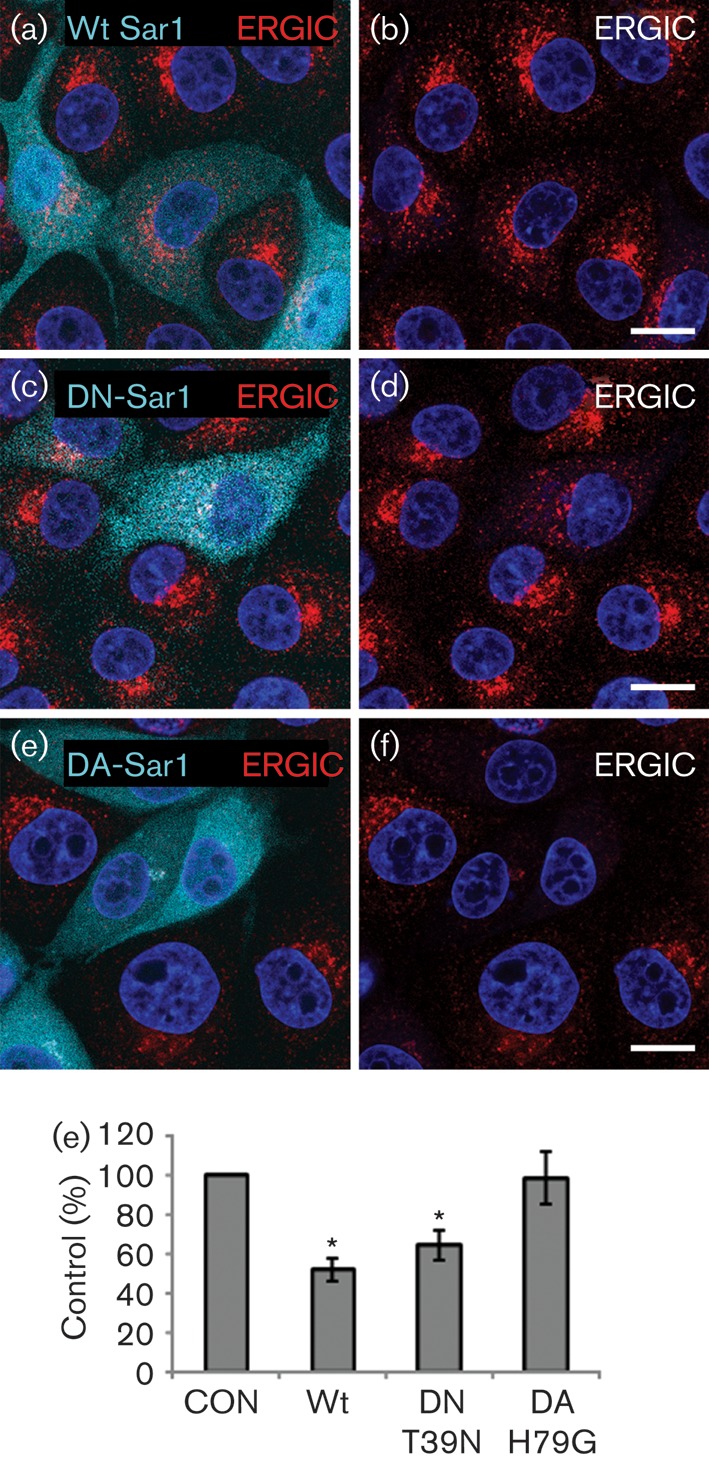
DN-Sar1 but not DA-Sar1 inhibits FMDV infection. IBRS2 cells were transfected with wt Sar1a (CFP-wt-Sar1a), DN-Sar1a (CFP-DN-Sar1aT39N) or DA-Sar1a (CFP-DA-Sar1aH79G). (a) Cells transfected with wt Sar1a (cyan) labelled for the ERGIC (ERGIC-53, red). (b) The same cells as in (a) showing ERGIC labelling only. (c) Cells transfected with DN-Sar1a (cyan) labelled for the ERGIC (ERGIC-53, red). (d) The same cells as in (c) showing ERGIC labelling only. (e) Cells transfected with DA-Sar1a (cyan) labelled for the ERGIC (ERGIC-53, red). (f) The same cells as in (e) showing only ERGIC labelling. The cell nuclei are shown in blue. Bars, 10 μm. (g) Cells were transfected with wt Sar1a, DN-Sar1a or DA-Sar1a and infected with FMDV (m.o.i. 0.5) for 3.5 h. The level of infection of cells positive for a Sar1 transgene was normalized to the non-expressing cells (control, CON) of the same coverslip. The data show the mean±sem for at least three independent experiments, each carried out with triplicate samples (n≥500 cells per coverslip). Student’s t-test was used to determine statistical significance (*P<0.05).
