Fig. 7.

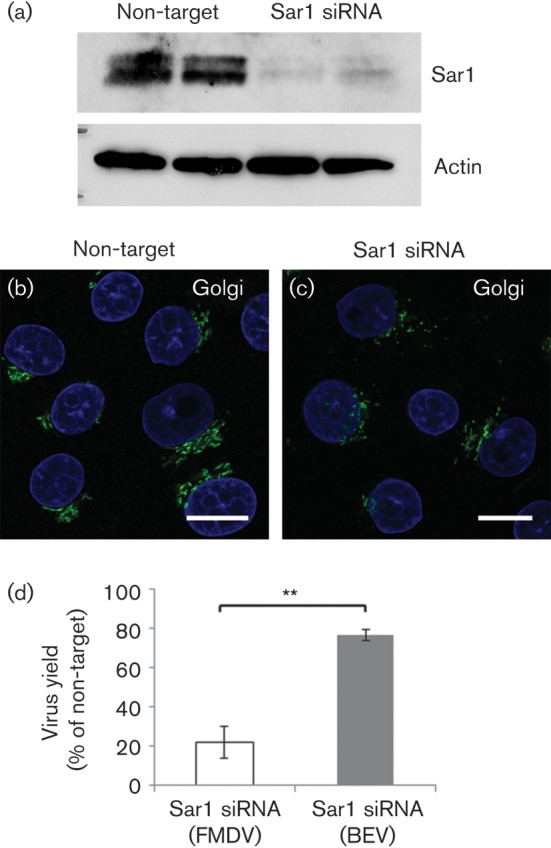
Sar1siRNA inhibits FMDV infection. IBRS2 cells were transfected with non-target siRNA or Sar1-targeted siRNA. (a) Western blot for Sar1 and actin (loading control). In the Sar1 blot, the upper band is Sar1b and the lower band Sar1a. Shown are the representative results for duplicate transfections. (b) Cells transfected with non-target siRNA labelled for the Golgi (GM130, green). (c) Cells transfected with Sar1 siRNA and similarly labelled for the Golgi. Cell nuclei are shown in blue. Bars, 10 μm. (d) IBRS2 cells were transfected with non-target or Sar1-targeted siRNA and infected with either FMDV or BEV (m.o.i. 1.0). Shown is the virus yield at 4 h p.i. for the cells transfected with Sar1 siRNA as a percentage of virus yields for the cells transfected with the non-target siRNA. Open bars show data for FMDV; grey bars show data for BEV. The data show the mean±sem for three independent experiments, each carried out with triplicate samples. Student’s t-test was used to determine statistical significance (**P<0.01).
