
Fig. 4.
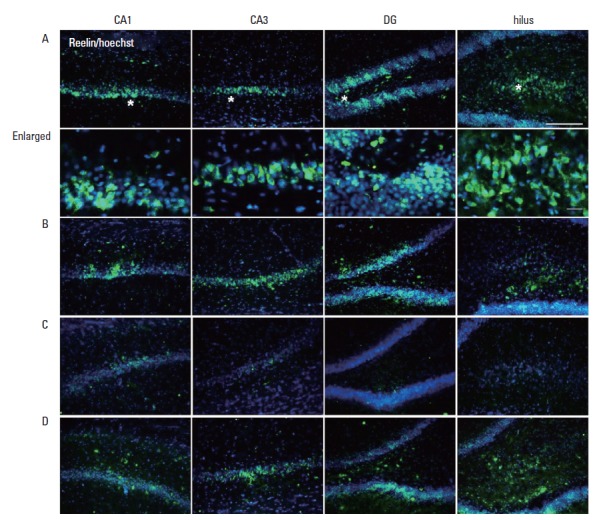
Photomicrographs of reelin expressions in the CA1, CA3, hilus, and dentate gyrus of the hippocampus. The scale bar represents 100 μm. (A) Control group, (B) control and exercise group, (C) valproic acid (VPA)-treated group, (D) VPA-treated and treadmill exercise group. Enlarged images are to magnify the asterisk area in photo A. The scale bar represents 100 μm.