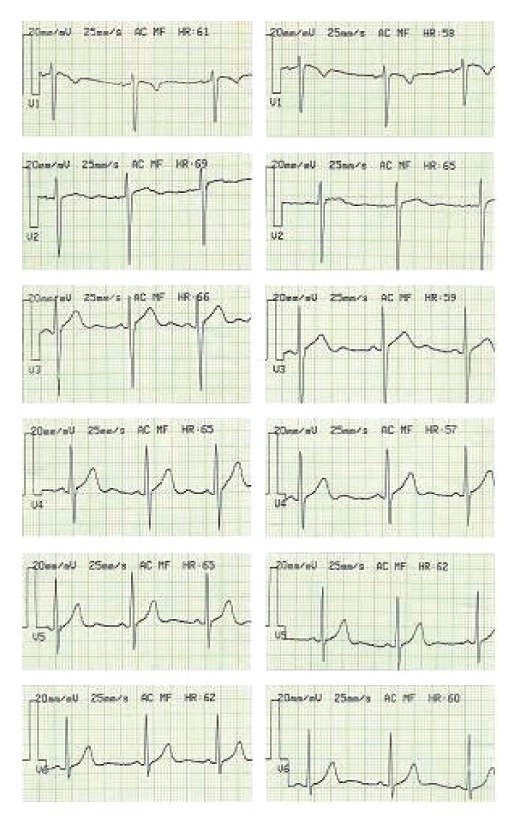
Fig. 2.

Changes of heart rates in six chest leads in the Ylang-Ylang group. Left lines: Sample figures of six chest leads (from V1 to V6) in the pre-test. Right lines: Sample figures of the same leads in the post-test. The heart rate is represented in the upper right end.
