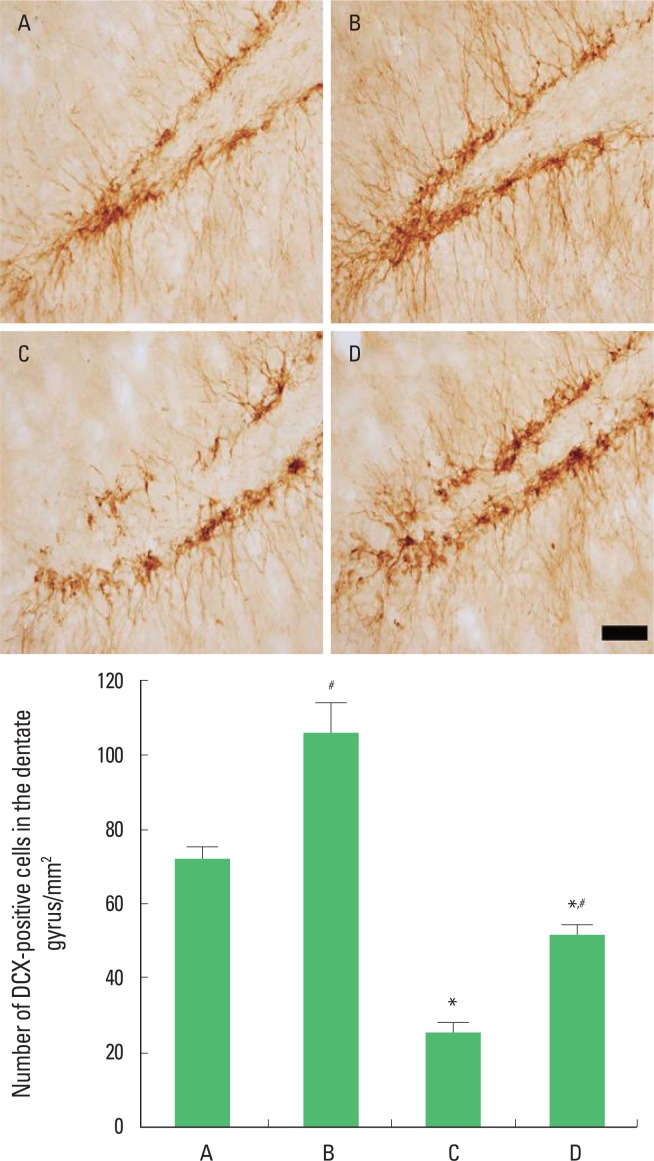
Fig. 3.
Effect of exercise on doublecortin (DCX) expression in the hippocampal dentate gyrus. Upper: Photomicrographs of DCX-positive cells. The scale bar represents 50 μm. Lower: The number of DCX-positive cells. (A) Control group, (B) control and exercise group, (C) PTSD-induced group, (D) PTSD-induced and exercise group. The data are represented as the mean± standard error of the mean (SEM). *Represents P< 0.05 compared to the control group. #Represents P< 0.05 compared to the PTSD-induced group.

