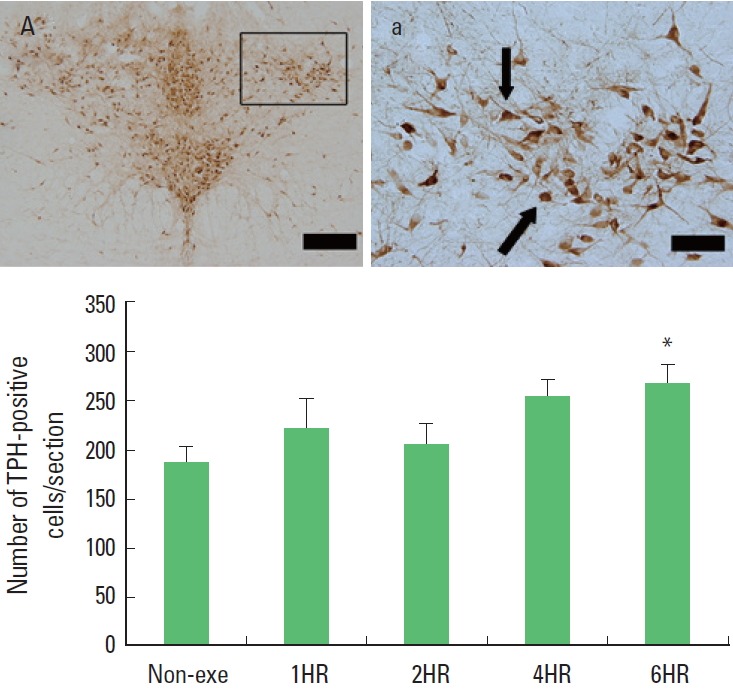
Fig. 4.

The effect of one bout treadmill exercise on tryptophan hydroxylase (TPH)-positive cells in the dorsal raphe. Upper: Photomicrographs of TPH-positive cells. Arrows indicate TPH-positive cells. The scale bar represents 100 μm (A) and 25 μm (a). Lower: The number of TPH-positive cells. The data are represented as the mean± standard error of the mean (SEM). Non-exe, non-exercise (control) group; 1HR, 1-h exercise group; 2HR, 2-h exercise group; 4HR, 4-h exercise group; 6HR, 6-h exercise group. *represents P< 0.05 compared to the control group.
