Fig. 7.

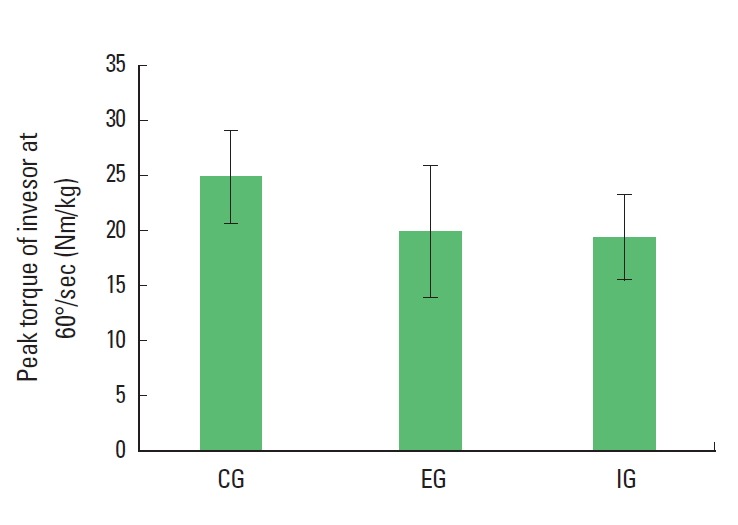
Differences in the muscle strength in varus at an angular velocity of 60°/sec between groups. CG, control group; EG, exercise group; and IG, injured group.

Differences in the muscle strength in varus at an angular velocity of 60°/sec between groups. CG, control group; EG, exercise group; and IG, injured group.