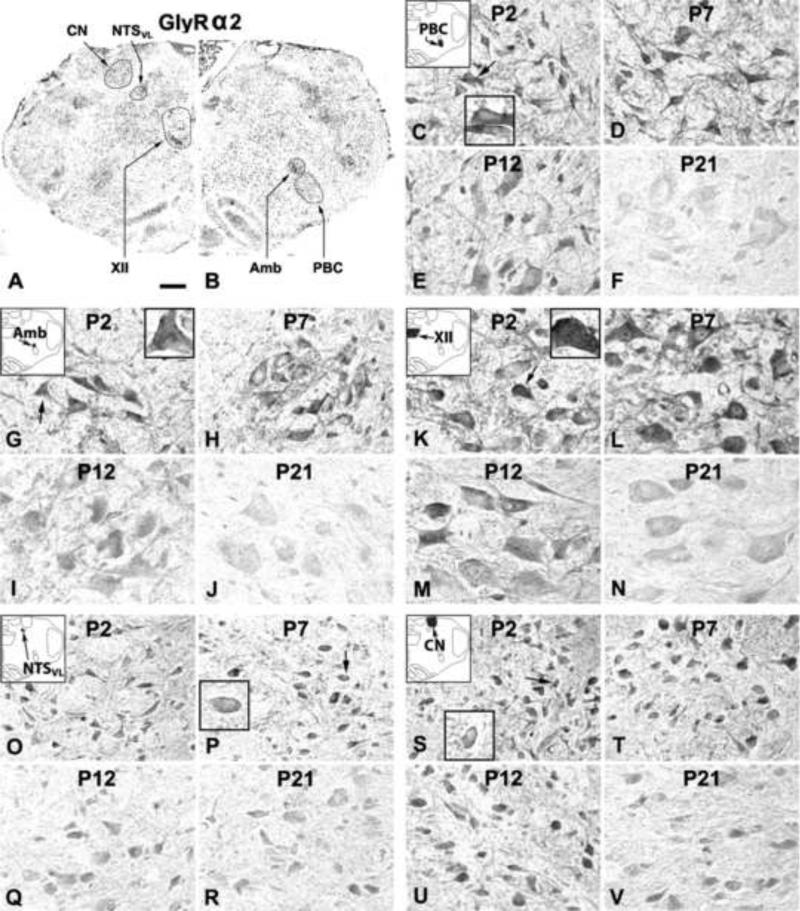
Figure 3.
A and B. Low magnification micrograph of rat brain stem section at P7 immuno-reacted for GlyRα2. GlyRα2-ir neurons and neuropil in the PBC (C-F), Amb (G-J), XII (K-N), NTSVL (O-R), and CN (S-V) at P2, P7, P12, and P21. In the first four nuclear groups, GlyRα2-ir expression was highest at P2 and P7, slightly reduced at P12, and further reduced at P21. The pattern in the CN was more constant from P2 to P21. The intensity of neuropil labeling in all nuclear groups was similar to those of neuronal cell bodies. Plasma membrane labeling was observable at P2, P7, and P12 (see arrows and insets in C, G, K, P, and S), but was not clearly detectable at P21. Scale bar: 345 μm for A and B; 20 μm for the rest (6.66 μm for small insets).

