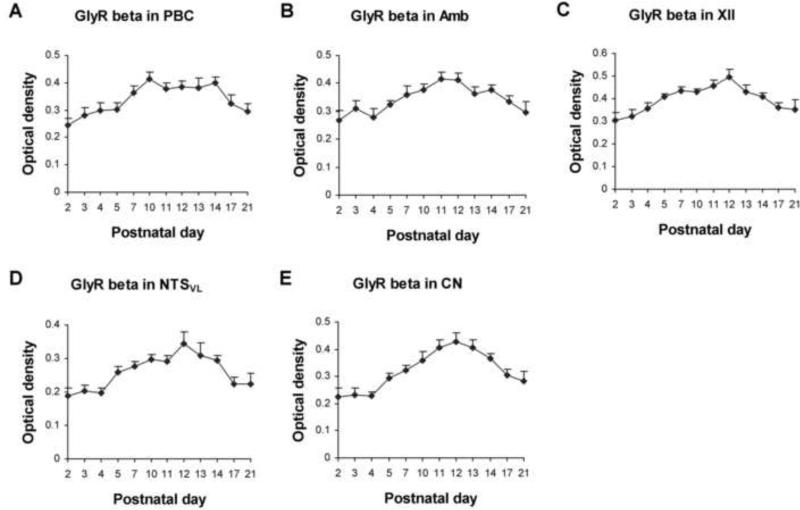
Figure 8.
Optical densitometric measurements of immunoreaction product for GlyRβ-ir in individual neurons of the PBC (A), Amb (B), XII (C), NTSVL (D), and CN (E) from P2 to P21. In all five nuclear groups, GlyRβ-ir was lowest at P2, increased thereafter to reach a peak around P12, followed by a gradual decline until P21. ANOVA revealed significant differences in the expression of GlyRβ-ir among the ages in all five nuclear groups (P < 0.01; not shown), but Tukey's test did not yield significant differences between any two adjacent age groups.

