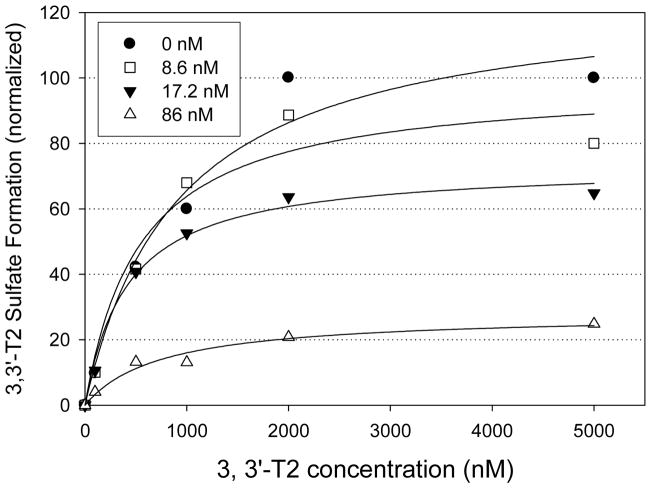
Figure 9.
3,3′-T2 sulfate formation rate (data points normalized to the formation rate when [S] = 5000 nM, 4-OH BDE 90 = 0 nM) of resulting from incubation of 3,3′-T2 with varying concentrations of 4-OH BDE 90 (0, 8.6, 17.2 and 86 nM) in 0.25 mg protein/ml of pooled human liver cytosol for 30 min. Best fit lines obtained using nonlinear regression analysis. Each data point represents the mean (n=2). Error bars were not shown for clarity.

