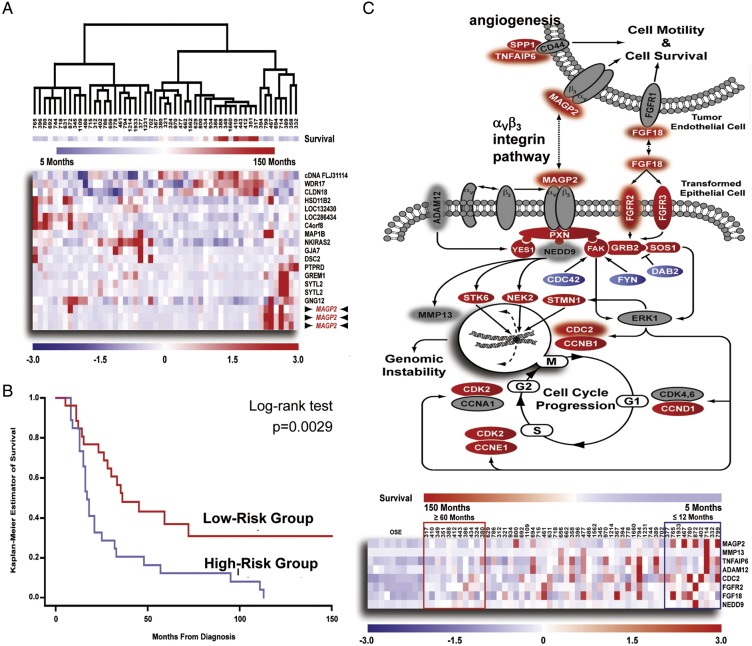
Figure 3.
Identification of a prognostic gene expression signature correlating with survival in microdissected advanced-stage HGSCs. (A) Hierarchical clustering of 53 advanced-stage HGSCs using expression values for genes possessing a Cox score >10. (B) Kaplan–Meier analysis of the predictor demonstrated a significant difference in survival time (P = 0.0029). (C) Assessment of putative signaling events contributing to patient survival through pathway analysis. Differentially regulated genes identified in the 53 microdissected serous tumors, when compared with 10 normal OSE brushings were labeled with white fonts. Genes predictive of poor prognosis is cycled with halo. A heat map is shown below to demonstrate association between survival signature genes identified in the pathway and overall patient survival. Adapted from Mok et al. [58].

