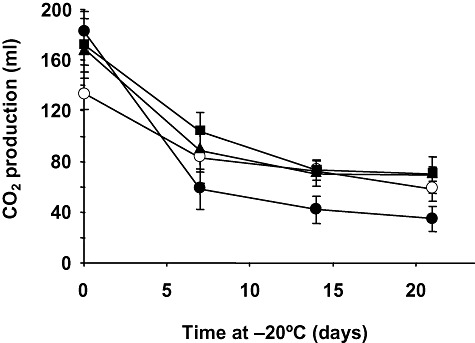
Figure 1.

Freeze tolerance of cells harvested from the evolved populations. Molasses‐grown yeast cells from the parental (●), 50‐ ( ), 100‐ (
 ) and 200‐generation (○) evolved populations were transferred to LD medium and total CO2 production at 30°C was measured before (control, time 0) and after freezing and frozen storage at −20°C for 7, 14 or 21 days. The amount of CO2 produced for 180 min at 30°C was recorded in a home‐made fermentometer. Frozen samples were thawed at 30°C for 30 min before measuring gassing power. Values are expressed as ml of CO2 per sample. In all cases, values represent the means of at least three independent experiments. The error associated with the points was calculated by using the formula:
  , where n is the number of measurements. Additional details are given in the Experimental procedures section.
