
Figure 2.
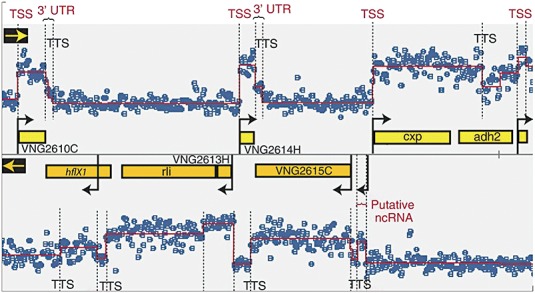
Transcriptome structure in H. salinarum determined with high‐density tiling arrays (60‐mer overlapping probes). Segment of genome map with signal intensity of total RNA is shown. Each blue dot represents probe intensity (in log2 scale) in the forward (upper panel) or reverse strand (lower panel). The overlaid red line is the result of a segmentation algorithm that was applied to determine transcription start sites (TSS and black arrows), transcription termination sites (TTS), untranslated regions in mRNAs (3′ UTR) and putative non‐coding RNAs. Reprinted and adapted from Koide et al. (2009). Copyright 2009, EMBO and Macmillan Publishers Limited.