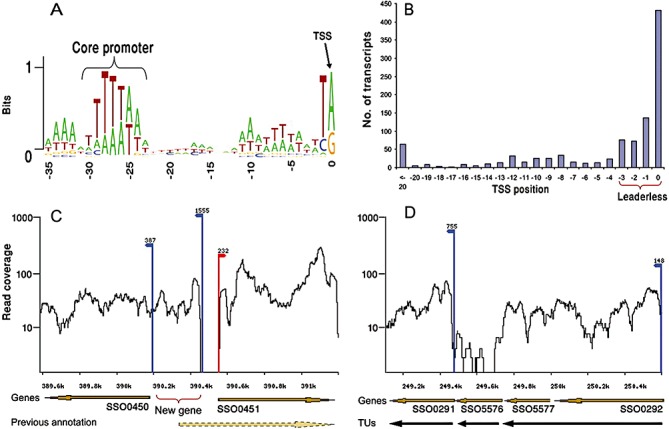
Figure 3.

The structure of the S. solfataricus transcriptome determined by RNA‐seq. A. Core promoter. B. Distribution of mapped TSS (transcription start site) positions relative to the ORF ATG codon. C. Example of correction of gene annotations. Transcriptome data indicate that gene SSO0451 actually is 228 bp shorter, and that a new small gene is encoded on the reverse strand. D. Refinement of operon definition. Transcriptome data show either 2 or 3 separate transcriptional units (TU), instead of the predicted 1 TU. Red arrow indicates TSS on forward strand, and blue arrows indicate TSS on reverse strand. Reprinted from Wurtzel et al. (2010). Copyright 2009, Cold Spring Harbor Laboratory Press.
