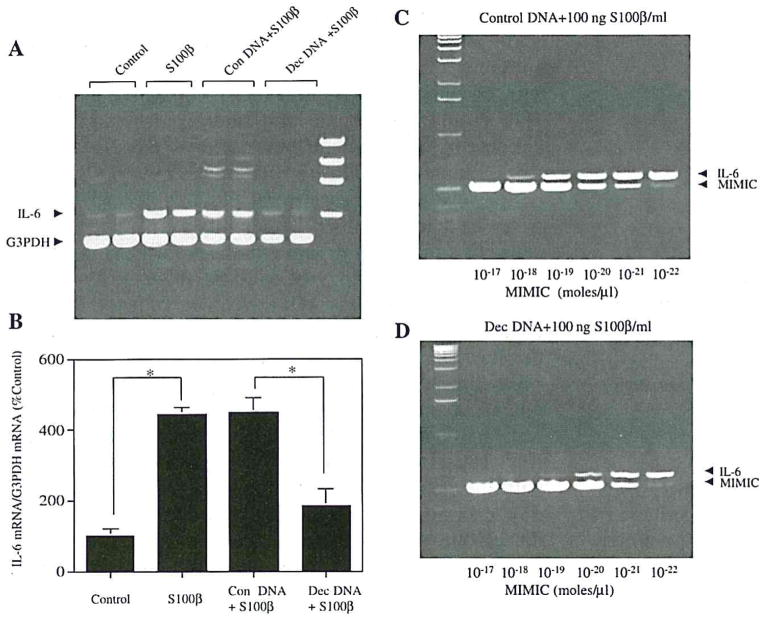
FIG. 4.
Suppression of κB DNA binding blocks S100β induction of IL-6 mRNA expression in cortical neuron cultures. A: An example of RT-PCR results. Lanes 1 and 2 represent IL-6 mRNA levels following incubation with control medium. Lanes 3 and 4 represent IL-6 mRNA levels following treatment with S100β (100 ng/ml). Lanes 5 and 6 represent IL-6 mRNA levels following simultaneous treatment with S100β (100 ng/ml) and control (Con) DNA (100 nM). Lanes 7 and 8 represent IL-6 mRNA levels following simultaneous treatment with S100β (100 ng/ml) and “decoy” (Dec) DNA (100 nM). B: Densitometric analysis of ethidium bromide-stained gels. IL-6 mRNA levels relative to G3PDH mRNA levels are expressed relative to values in control cultures. Data are mean ± SEM (bars) values for four individual samples. Indicated values are significantly different: *p < 0.01. C and D: Competitive RT-PCR, performed on aliquots of samples used for analysis shown in lanes 5 and 7 of A. There is an ~10-fold difference in IL-6 mRNA expression between S100β+ control DNA-treated (C) and S100β+ Dec DNA-treated (D) cultures.

