


Figure 1.
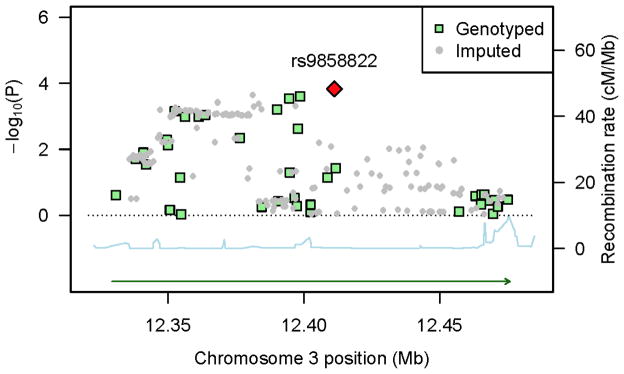
P-values in the Multiethnic Cohort for genotyped and imputed in the PPARG region as a function of genetic position (HG19), along with recombination rates (combined rates from HapMap) that reflect local LD structure. The top hit SNP is shown as a red diamond. SNP density is not ideal at some region because only SNPs with high imputation accuracy (R2 > 0.8) in ALL five ethnic groups were analyzed and R2 can vary a lot due to differences in allele frequencies and linkage disequilibrium patterns across populations.