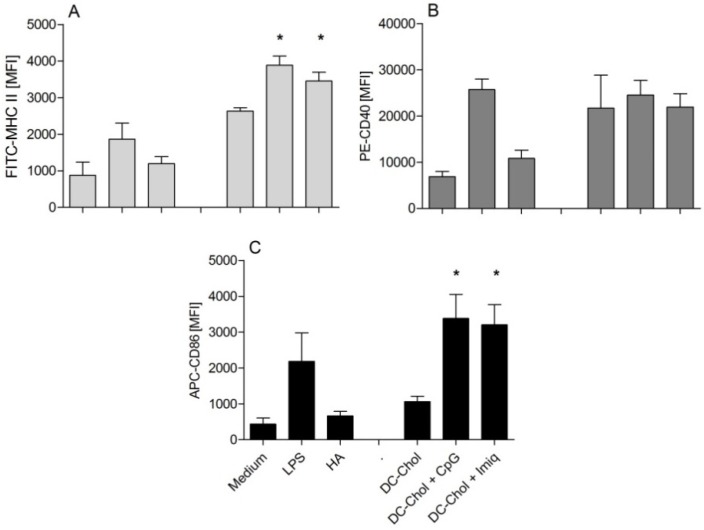
Figure 4.
Upregulation of DC maturation markers induced by free HA versus HA mixed with liposomes: MHCII (A); CD40 (B); and CD86 (C). The values are expressed as percentage of mean fluorescence intensity (compared to a 100 ng/mL LPS control group, arbitrarily set as 100%). Error bars represent SEM (n = 3). Significant differences between the formulations and the DC-Chol:DPPC group are indicated with * (p < 0.05). See Supplementary Material, Figure S2, for representative side scatter-forward scatter dot plots.

