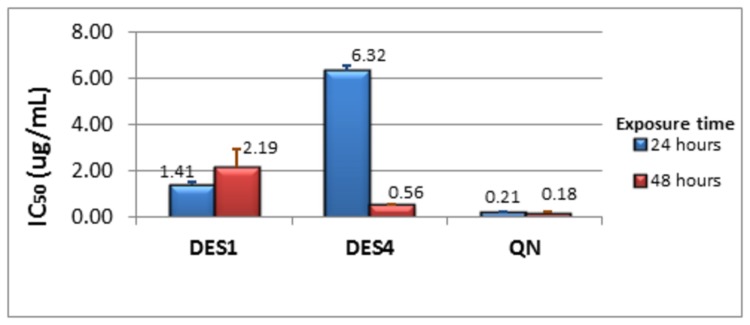
Figure 2. Variation of IC50 against Dd2 with exposure time.

IC50 after 24 hours in blue; IC50 after 48 hours in red. The IC50 values presented were obtained from two distinct experiments run in duplicate each.

IC50 after 24 hours in blue; IC50 after 48 hours in red. The IC50 values presented were obtained from two distinct experiments run in duplicate each.