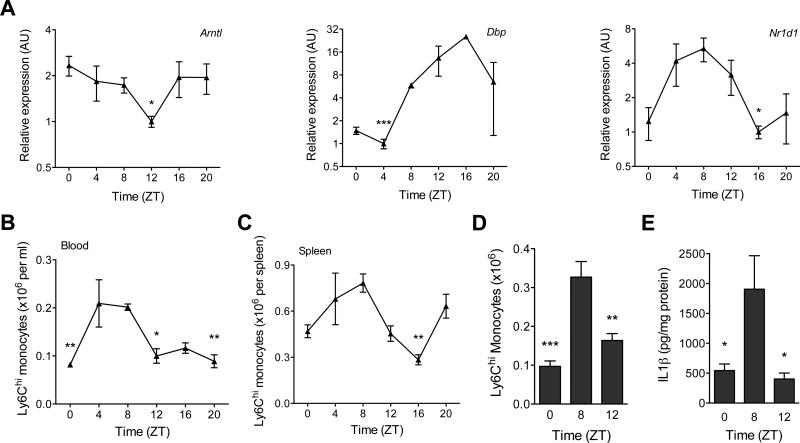
Fig. 1. Diurnal variation of Ly6Chi monocytes.
(A) Quantitative RT-PCR analysis of clock controlled genes (Arntl, Nr1d1, and Dbp) in blood monocytes during a 12 hour light-dark cycle (n = 3-4 samples per time point). (B and C) Ly6Chi monocyte numbers in blood (B) and spleen (C) during a 12 hour light-dark cycle (n=5 mice per time point). (D and E) Recruitment of Ly6Chi monocytes to inflamed peritoneum. Ly6Chi monocyte number (D), and concentration of IL1β (E) were quantified in the peritoneal fluid 2 hours after elicitation with thioglycollate (n = 5 mice per time point). Pooled data (A) or representatives (B to E) of two independent experiments are shown as mean ± SEM. Two-tailed Student's t-tests (A) and one-way ANOVA (B-E) are used for statistical analyses (comparisons were made between the acrophase and other time points). *P<0.05; **P<0.01; ***P<0.001.

