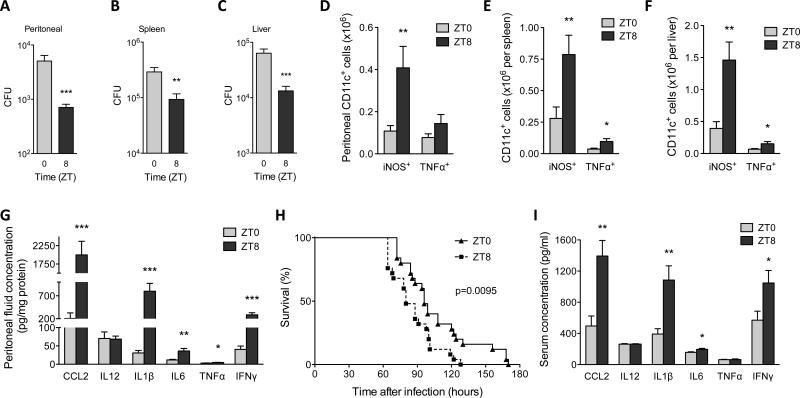
Fig. 2. Diurnal variation in the pathogenicity of Listeria monocytogenes.
(A to C) Mice kept under a 12 hour light-dark cycle were intraperitoneally inoculated with 1×10⁶ L. monocytogenes at ZT0 and ZT8, and colony forming units (CFUs) recovered from the peritoneal cavity (A), spleen (B), and liver (C) were quantified 2 dpi (n = 14-15 mice per time point). (D to F) Numbers of iNOS+CD11c+ and TNFα+CD11c+ cells in peritoneal cavity (D), spleen (E), and liver (F) of mice 2 dpi with 1×10⁶ L. monocytogenes at ZT0 and ZT8 (n = 15 mice per time point). (G) Concentration of chemokines and cytokines in peritoneal fluid 2 dpi with 1×10⁶ L. monocytogenes at ZT0 and ZT8 (n = 15 mice per time point). (H) Survival curves of mice after infection with 1×10⁷ L. monocytogenes at ZT0 and ZT8 (n = 25 mice per time point). (I) Serum concentration of chemokines and cytokines 2 dpi with 1×10⁷ L. monocytogenes at ZT0 and ZT8 (n = 10 mice per time point). Pooled data from two or three independent experiments are presented as mean ± SEM. Statistical significance (*P<0.05; **P < 0.01; ***P < 0.001) was assessed using two-tailed Student's t-test (A to G, and I), and log-rank test (H).

