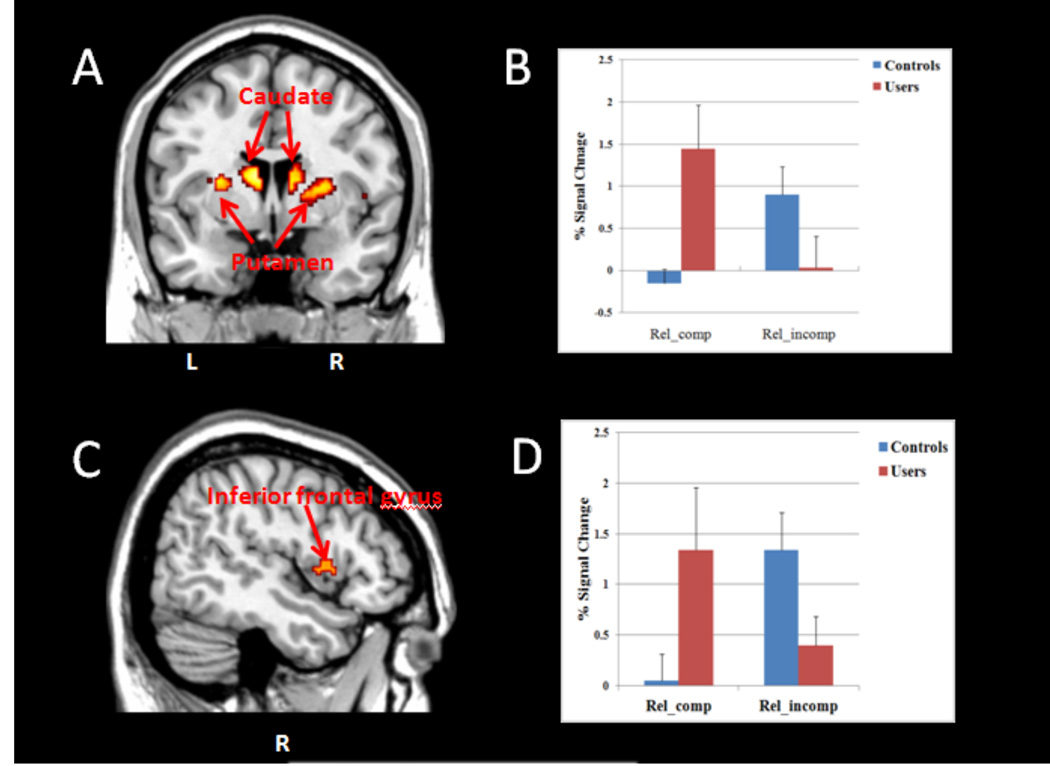
Figure 3.
Interaction effect during compatible & incompatible trials by user and control groups in subcortical and cortical regions. A. Coronal view of activity in the caudate and putamen. B. Percent (%) signal change for both caudate and putamen. Error bars denote within-subject error. C. Sagittal view of the activity in the right inferior frontal gyrus. D. % signal change for the right inferior frontal gyrus. Error bars denote within-subject error. Significance set at p<.005, uncorrected, voxels>30.

