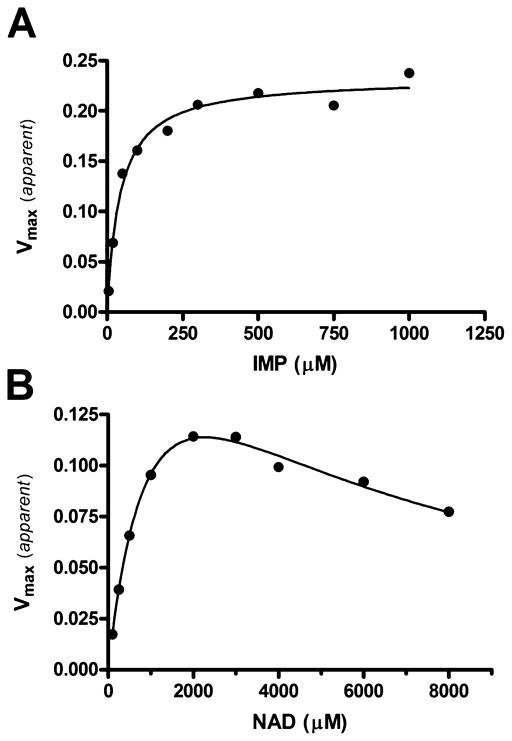
Figure 6.
Steady state kinetics of B. anthracis IMPDH. (A) Secondary plot of kinetic data showing apparent Vmax values (from initial velocity vs NAD+ plots) plotted vs IMP concentration. The solid line represents the best fit to eq 1 for Michaelis–Menten kinetics. (B) Secondary plot of kinetic data showing apparent Vmax values (from initial velocity vs IMP plots) plotted vs NAD+ concentration. The solid line represents the best fit to eq 2 for uncompetitive substrate inhibition.

