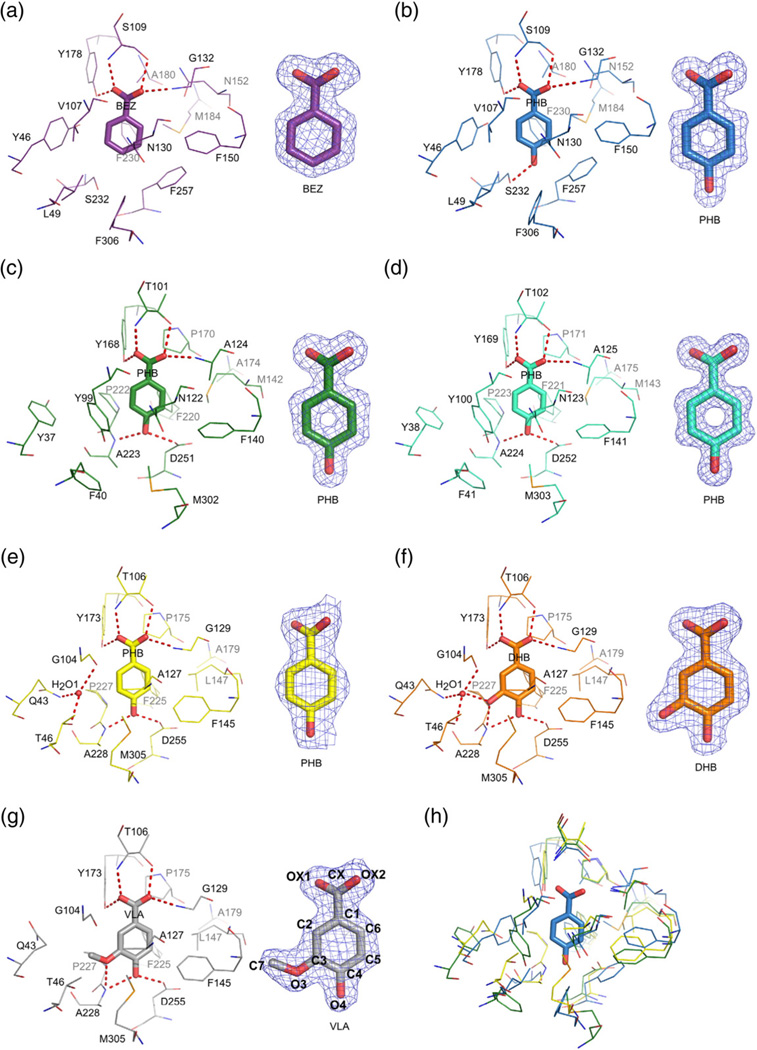
Fig. 4.
Ligand binding in R. palustris cluster I SBPs. The ligand molecules are shown in a stick representation. Potential hydrogen bonds are depicted as broken lines. On the right, 2mFo–DFc electron density map contoured at the 1σ level for each ligand is shown. (a) RPA0668/BEZ; (b) RPA0668/PHB; (c) RPA0985/PHB; (d) RPB2270/PHB; (e) RPD1586/PHB; (f) RPD1586/DHB; (g) RPD1586/VLA; (h) superposition of RPA0668/PHB (blue), RPA0985/PHB (green), and RPD1586/ PHB (yellow). For clarity, only the PHB ligand from the RPA0668 complex is shown (in a stick representation). The numbering of ligand atoms used throughout the text corresponds to the labeling scheme shown for VLA.

