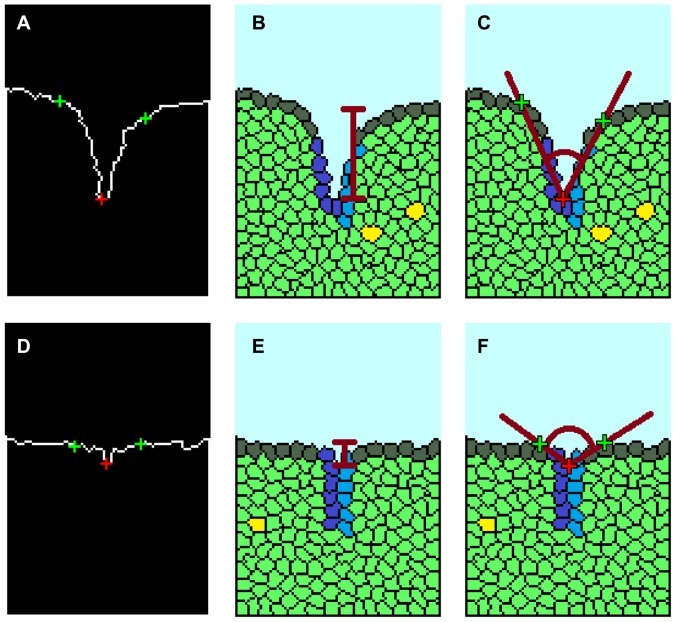
Figure 4. Quantitative analysis of cleft formation.
A MatLab function was created for tracing the border of the local cleft. (a) The two cleft extremes were labeled in green and the cleft tip in red. A MatLab tracing of a successful cleft at 1500 MCS shows a (b) high cleft depth and (c) low spanning angle (red lines). (d) MatLab tracing of a non-progressive cleft at 1500 MCS shows (e) low cleft depth and (f) high spanning angle.

