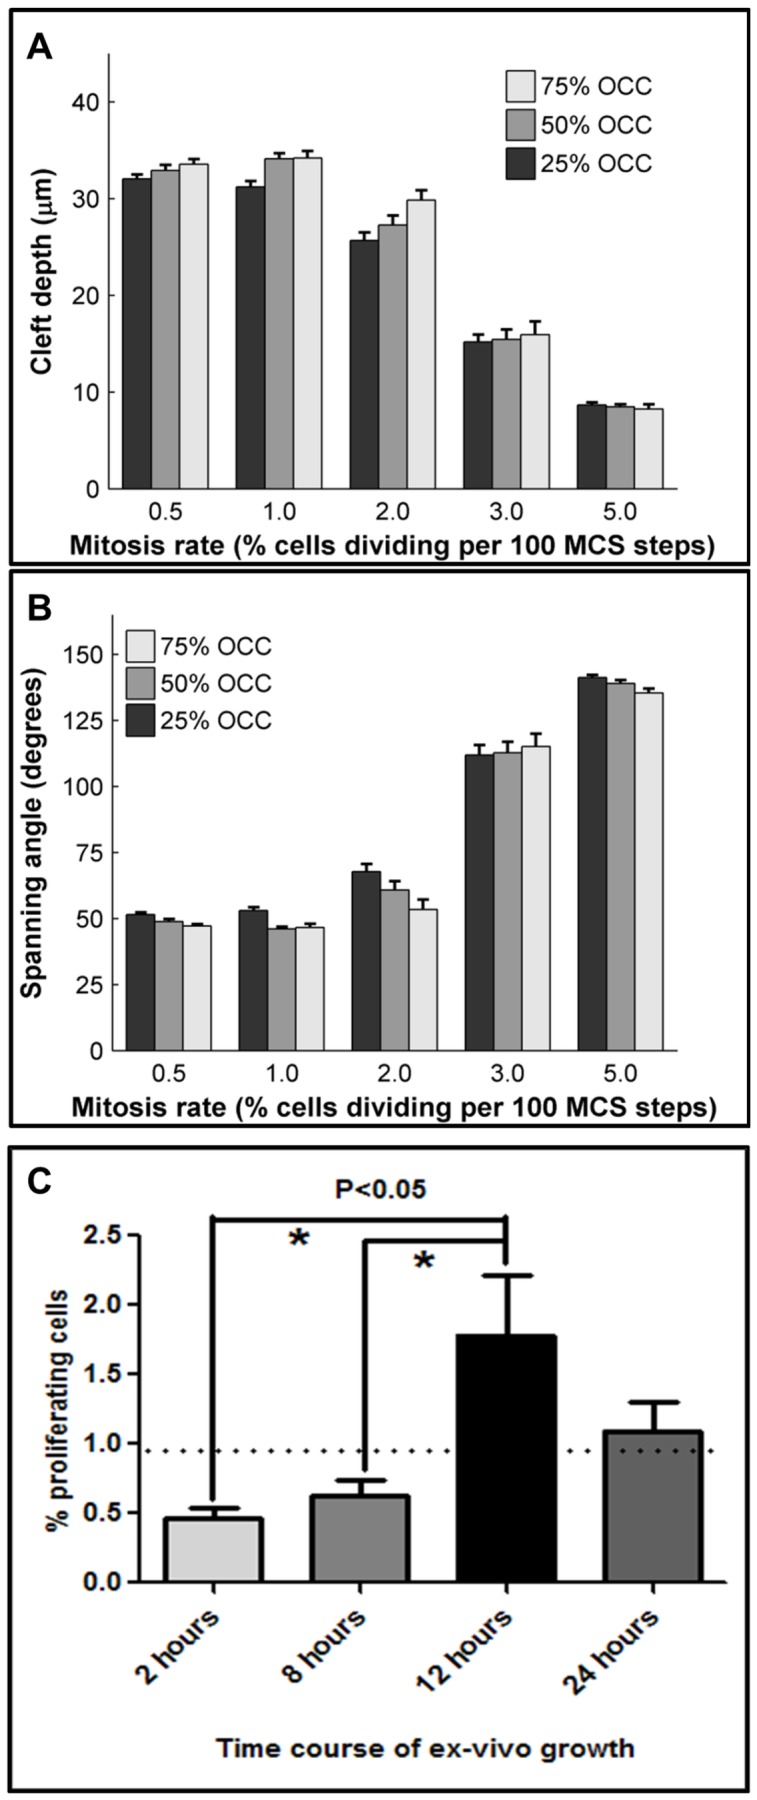
Figure 7. Effect of varying mitosis location on cleft progression.

The location of proliferating epithelial cells was varied, with 25%, 50% or 75% mitosis occurring in the OCC population, while the MR rate was also varied from 0.5–5%. Results were quantified as (a) cleft depth and (b) spanning angle. The location of proliferating cells had an effect on cleft formation with 50–75% proliferation in the OCCs generally being more effective than 25%. (c) Image segmentation and analysis of confocal images acquired from pHH3 ICC and SYBR green-stained explants at four time points shows temporal changes in mitosis rate that produce an average epithelial mitosis rate of 0.99% between 2–24 hours of ex vivo culture. Dotted line denotes average mitosis rate (0.99%), ANOVA *P<0.05, n = 6.
