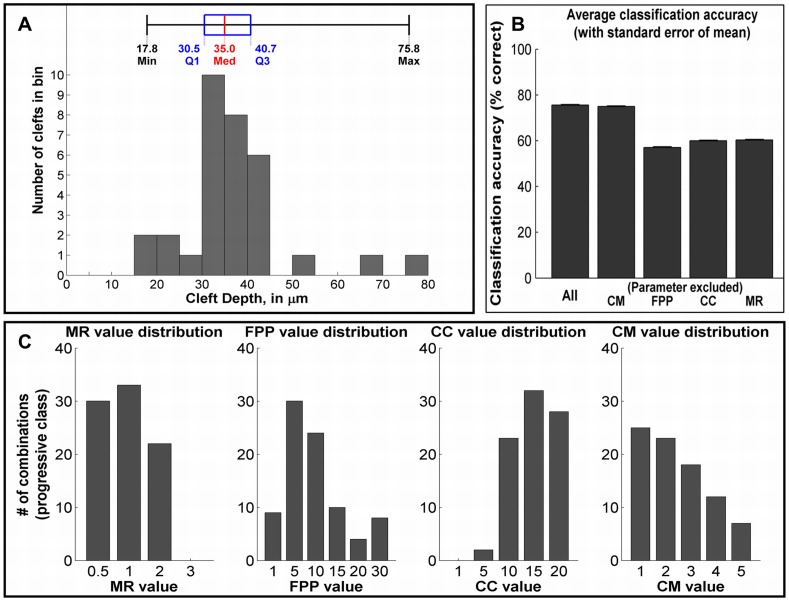
Figure 9. Classification analysis.
(a) Distribution of cleft measurements from SMG organ explant image data. Classes for parameter combinations were assigned as follows: failed, <17.8 µm; non-progressive, 17.8–30.5 µm; progressive, 30.5–40.7 µm; super-progressive, >40.7 µm. (b) Cross-validated classification accuracy on test set for the full parameter combination (CC, CM, FPP and MR), and exclusion of a single parameter CC, CM, FPP, or MR. A larger decrease in accuracy indicates greater importance. (c) Parameter value distributions within the progressive class. Peaks indicate higher importance for that value in progressive cleft formation.

