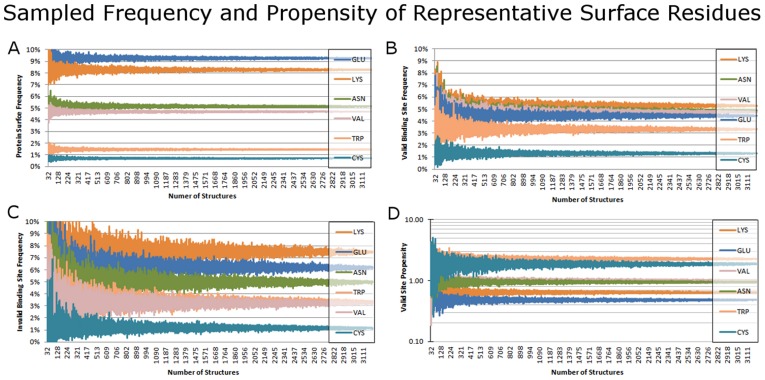
Figure 7. Examining the variation in the data, based on sample size.
A) Protein surface, B) valid binding site, and C) invalid binding site frequencies, and D) valid binding site propensities of six residues. Values for subsets of the protein structure set, from 1% to 99% of the full set are shown, with 100 samples at each percent point.

