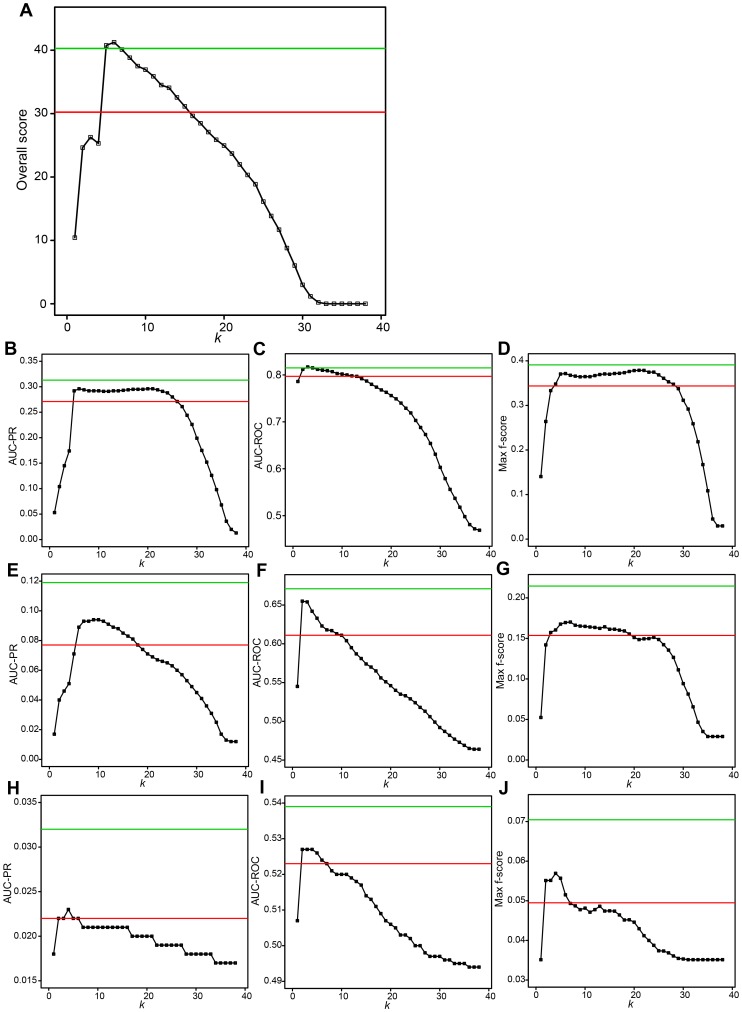
Figure 2. Performances of TopkNet and community prediction based on integration of the 38 network-inference algorithms.
Black squares and lines show performances of TopkNet algorithm. For example, values at k = 1 represent performances of Top1Net algorithm. Red and green lines represent performances of community prediction and those of the best algorithm, respectively. (A) Overall score. (B) AUC-PR for in silico dataset. (C) AUC-ROC for in silico dataset. (D) Max f-score for in silico dataset. (E) AUC-PR for E. coli dataset. (F) AUC-ROC for E. coli dataset. (G) Max f-score for E. coli dataset. (H) AUC-PR for S. cerevisiae dataset. (I) AUC-ROC for S. cerevisiae dataset. (J) Max f-score for S. cerevisiae dataset.

